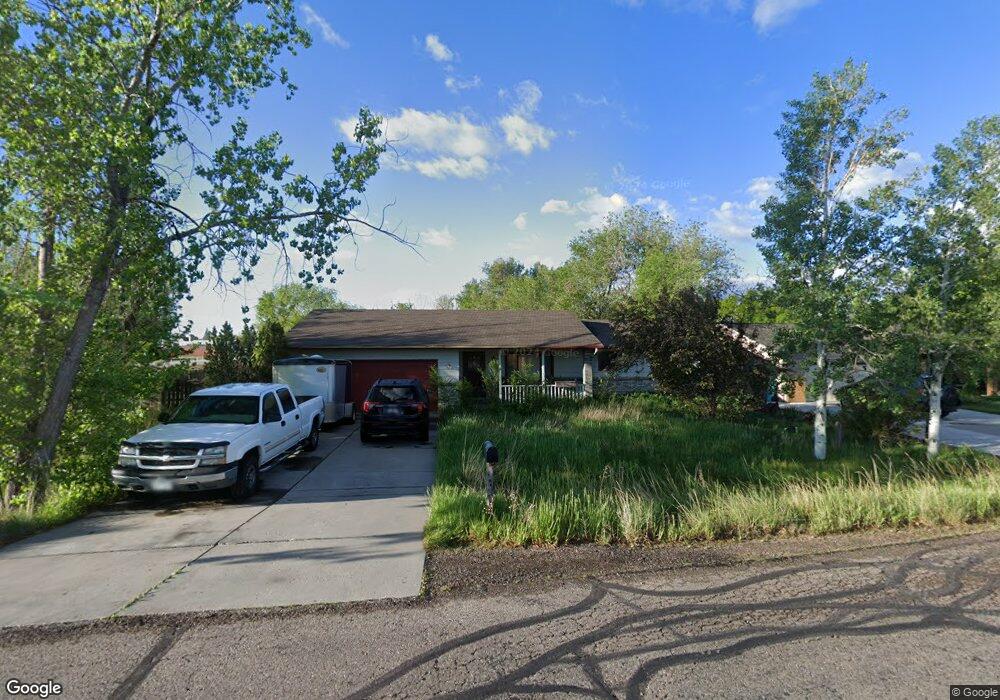
4100 10th St SW Loveland, CO 80537
Estimated Value: $421,605 - $504,000
3
Beds
2
Baths
1,132
Sq Ft
$399/Sq Ft
Est. Value
About This Home
This home is located at 4100 10th St SW, Loveland, CO 80537 and is currently estimated at $452,151, approximately $399 per square foot. 4100 10th St SW is a home located in Larimer County with nearby schools including Namaqua Elementary School, Walt Clark Middle School, and Thompson Valley High School.
Ownership History
Date
Name
Owned For
Owner Type
Purchase Details
Closed on
Feb 18, 2015
Sold by
Sweet Kristy and Sweet Gary
Bought by
Sweet Jaimi
Current Estimated Value
Purchase Details
Closed on
Jul 21, 2009
Sold by
Sweet Kristy and Estate Of Elinor Ruth Knott
Bought by
Sweet Kristy and Sweet Gary
Purchase Details
Closed on
Aug 29, 2001
Sold by
Rank Brian L
Bought by
Knott Harold E and Knott Elinor R
Home Financials for this Owner
Home Financials are based on the most recent Mortgage that was taken out on this home.
Original Mortgage
$92,000
Interest Rate
6.98%
Purchase Details
Closed on
May 6, 1999
Sold by
Devine Timothy L and Devine Susan L
Bought by
Rank Brian L
Home Financials for this Owner
Home Financials are based on the most recent Mortgage that was taken out on this home.
Original Mortgage
$112,000
Interest Rate
6.99%
Purchase Details
Closed on
Apr 1, 1992
Sold by
Lagro Construction Co Inc
Bought by
Devine Susan L
Create a Home Valuation Report for This Property
The Home Valuation Report is an in-depth analysis detailing your home's value as well as a comparison with similar homes in the area
Home Values in the Area
Average Home Value in this Area
Purchase History
| Date | Buyer | Sale Price | Title Company |
|---|---|---|---|
| Sweet Jaimi | -- | First American | |
| Sweet Kristy | -- | None Available | |
| Knott Harold E | $165,000 | North American Title Co | |
| Rank Brian L | $140,000 | Larimer County Title Co Llc | |
| Devine Susan L | $72,500 | -- |
Source: Public Records
Mortgage History
| Date | Status | Borrower | Loan Amount |
|---|---|---|---|
| Previous Owner | Knott Harold E | $92,000 | |
| Previous Owner | Rank Brian L | $112,000 |
Source: Public Records
Tax History Compared to Growth
Tax History
| Year | Tax Paid | Tax Assessment Tax Assessment Total Assessment is a certain percentage of the fair market value that is determined by local assessors to be the total taxable value of land and additions on the property. | Land | Improvement |
|---|---|---|---|---|
| 2025 | $2,237 | $31,162 | $5,025 | $26,137 |
| 2024 | $2,159 | $31,162 | $5,025 | $26,137 |
| 2022 | $1,818 | $23,060 | $3,753 | $19,307 |
| 2021 | $1,866 | $23,724 | $3,861 | $19,863 |
| 2020 | $1,631 | $20,735 | $3,575 | $17,160 |
| 2019 | $1,603 | $20,735 | $3,575 | $17,160 |
| 2018 | $1,244 | $15,271 | $2,880 | $12,391 |
| 2017 | $1,071 | $15,271 | $2,880 | $12,391 |
| 2016 | $964 | $13,285 | $3,184 | $10,101 |
| 2015 | $955 | $13,280 | $3,180 | $10,100 |
| 2014 | $941 | $12,650 | $2,670 | $9,980 |
Source: Public Records
Map
Nearby Homes
- 4121 Silene Place
- 4108 Silene Place
- 3805 Panther Dr
- 3560 Peruvian Torch Dr
- 4289 Bluffview Dr
- 4347 Bluffview Dr
- 1014 Prism Cactus Cir
- 4377 Martinson Dr
- 3700 W 1st St
- 204 Shupe Cir
- 115 Anders Ct
- 781 Johnson Ave
- 138 Pamela Dr
- 543 Dana Ct
- 428 Candelaria Dr
- 5360 Lighthouse Point Ct
- 450 Wapola Ave
- 1158 Blue Agave Ct
- 1168 Blue Agave Ct
- 263 Rossum Dr
- 4104 10th St SW
- 4101 Rockcress Place
- 4108 10th St SW
- 4105 Rockcress Place
- 4109 Rockcress Place
- 4112 10th St SW
- 4104 Red Bird Place
- 4113 Rockcress Place
- 4116 10th St SW
- 4108 Red Bird Place
- 4100 Rockcress Place
- 4104 Rockcress Place
- 4117 Rockcress Place
- 1150 S County Road 21
- 4112 Red Bird Place
- 4108 Rockcress Place
- 4101 10th St SW
- 1104 Eaton Ave
- 4112 Rockcress Place
- 1108 Eaton Ave