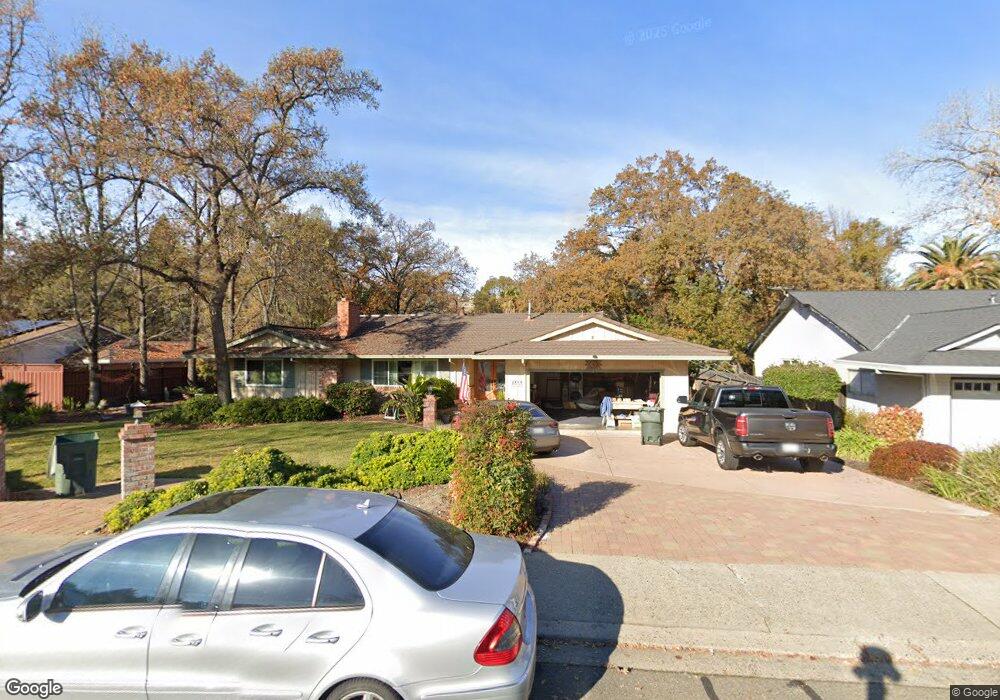
4100 Clover Valley Rd Rocklin, CA 95677
Clover Valley Woods NeighborhoodEstimated Value: $646,000 - $751,000
4
Beds
2
Baths
1,950
Sq Ft
$358/Sq Ft
Est. Value
About This Home
This home is located at 4100 Clover Valley Rd, Rocklin, CA 95677 and is currently estimated at $697,635, approximately $357 per square foot. 4100 Clover Valley Rd is a home located in Placer County with nearby schools including Parker Whitney Elementary School, Spring View Middle School, and Rocklin High.
Ownership History
Date
Name
Owned For
Owner Type
Purchase Details
Closed on
Oct 2, 2020
Sold by
Schimandle John M and Schimandle John M
Bought by
Schimandle John M
Current Estimated Value
Home Financials for this Owner
Home Financials are based on the most recent Mortgage that was taken out on this home.
Original Mortgage
$323,946
Outstanding Balance
$288,133
Interest Rate
2.9%
Mortgage Type
New Conventional
Estimated Equity
$409,502
Purchase Details
Closed on
Aug 25, 2017
Sold by
Wells Wendy Sue
Bought by
Revocab Schimandle John M
Purchase Details
Closed on
Jun 10, 2015
Sold by
Schimandle John
Bought by
Revocab Schimandle John M
Purchase Details
Closed on
Aug 28, 2014
Sold by
Wells Wendy Sue
Bought by
Wells Wendy Sue
Purchase Details
Closed on
Sep 24, 1996
Sold by
Ruffner Douglas K and Ruffner Alice F
Bought by
Schimandle John and Wells Wendy Sue
Home Financials for this Owner
Home Financials are based on the most recent Mortgage that was taken out on this home.
Original Mortgage
$196,200
Interest Rate
7.87%
Create a Home Valuation Report for This Property
The Home Valuation Report is an in-depth analysis detailing your home's value as well as a comparison with similar homes in the area
Home Values in the Area
Average Home Value in this Area
Purchase History
| Date | Buyer | Sale Price | Title Company |
|---|---|---|---|
| Schimandle John M | -- | None Available | |
| Revocab Schimandle John M | -- | None Available | |
| Revocab Schimandle John M | -- | None Available | |
| Wells Wendy Sue | -- | None Available | |
| Schimandle John | $218,000 | Old Republic Title Company |
Source: Public Records
Mortgage History
| Date | Status | Borrower | Loan Amount |
|---|---|---|---|
| Open | Schimandle John M | $323,946 | |
| Previous Owner | Schimandle John | $196,200 |
Source: Public Records
Tax History
| Year | Tax Paid | Tax Assessment Tax Assessment Total Assessment is a certain percentage of the fair market value that is determined by local assessors to be the total taxable value of land and additions on the property. | Land | Improvement |
|---|---|---|---|---|
| 2025 | $3,842 | $355,022 | $97,705 | $257,317 |
| 2023 | $3,842 | $341,238 | $93,912 | $247,326 |
| 2022 | $3,716 | $334,548 | $92,071 | $242,477 |
| 2021 | $3,675 | $327,989 | $90,266 | $237,723 |
| 2020 | $3,669 | $324,627 | $89,341 | $235,286 |
| 2019 | $3,618 | $318,263 | $87,590 | $230,673 |
| 2018 | $3,525 | $312,023 | $85,873 | $226,150 |
| 2017 | $3,527 | $305,906 | $84,190 | $221,716 |
| 2016 | $3,426 | $299,909 | $82,540 | $217,369 |
| 2015 | $3,384 | $295,405 | $81,301 | $214,104 |
| 2014 | $3,323 | $289,619 | $79,709 | $209,910 |
Source: Public Records
Map
Nearby Homes
- 0 Skyline Dr Unit 226016800
- 5247 Silver Peak Ln
- 4009 Whitney Vista Ln
- 3962 Rawhide Rd
- 3407 Stormy Ct
- 3445 Argonaut Ave
- 4057 Whitney Vista Ln
- 3105 Clarkson Dr
- 4551 Scenic Dr
- 3111 Clarkson Dr
- 4067 Whitney Vista Ln
- 4068 Whitney Vista Ln
- 3017 Crestwood Way
- 4056 Aitken Dairy Rd
- 3530 Cheri Ct
- 4362 Newland Heights Dr
- 4445 Willowglen Way
- 3110 Argonaut Ave
- 2935 Argonaut Ave
- 4158 Tahoe Vista Dr
- 4090 Clover Valley Rd
- 4110 Clover Valley Rd
- 3531 Buckskin Ct
- 3535 Buckskin Ct
- 4120 Clover Valley Rd
- 4080 Clover Valley Rd
- 4090 Silver St
- 4095 Silver St
- 4085 Clover Valley Rd
- 3421 Cimmeron Ct
- 4149 Rawhide Rd
- 4125 Clover Valley Rd
- 4140 Clover Valley Rd
- 4070 Clover Valley Rd
- 3527 Buckskin Ct
- 3539 Buckskin Ct
- 4075 Clover Valley Rd
- 3335 Copper Ct
- 3417 Cimmeron Ct
- 4085 Silver St
Your Personal Tour Guide
Ask me questions while you tour the home.