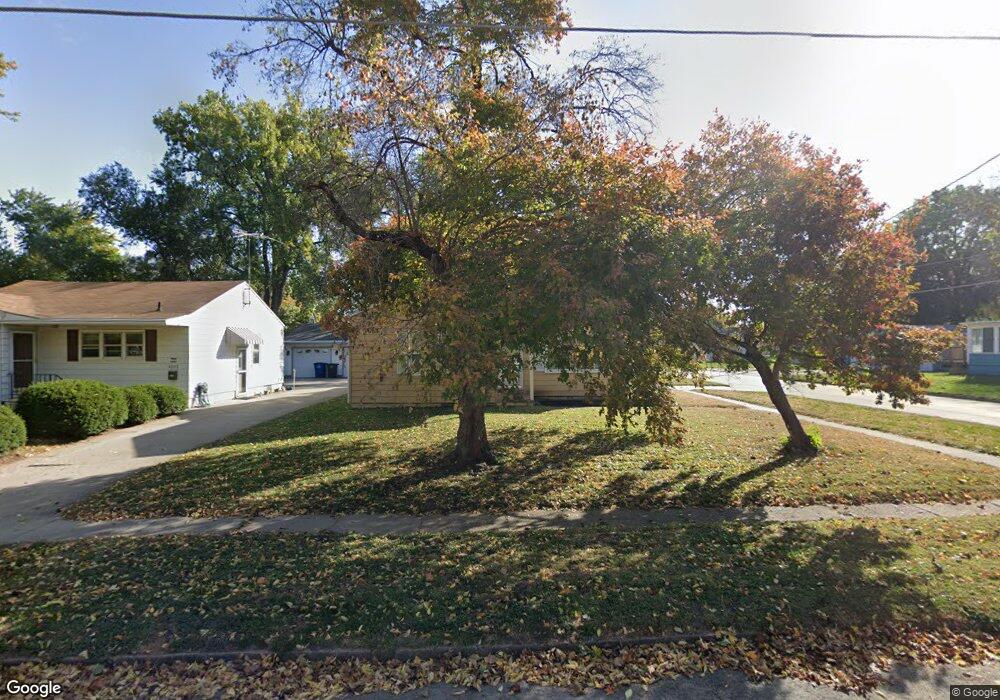
4101 4th St Des Moines, IA 50313
Highland Park NeighborhoodEstimated Value: $143,000 - $171,000
2
Beds
1
Bath
816
Sq Ft
$194/Sq Ft
Est. Value
About This Home
This home is located at 4101 4th St, Des Moines, IA 50313 and is currently estimated at $158,097, approximately $193 per square foot. 4101 4th St is a home located in Polk County with nearby schools including Oak Park Elementary School, Harding Middle School, and North High School.
Ownership History
Date
Name
Owned For
Owner Type
Purchase Details
Closed on
Oct 23, 2014
Sold by
Vanwyk Rory D and Vanwyk Van Wyk
Bought by
Geistkemper Mitchell L and Geistkemper Heather J
Current Estimated Value
Purchase Details
Closed on
Jul 14, 2013
Sold by
Dressen Anthony M and Dressen Rebecca
Bought by
Hopp Tiffaney
Home Financials for this Owner
Home Financials are based on the most recent Mortgage that was taken out on this home.
Original Mortgage
$147,343
Interest Rate
4.02%
Mortgage Type
New Conventional
Create a Home Valuation Report for This Property
The Home Valuation Report is an in-depth analysis detailing your home's value as well as a comparison with similar homes in the area
Home Values in the Area
Average Home Value in this Area
Purchase History
| Date | Buyer | Sale Price | Title Company |
|---|---|---|---|
| Geistkemper Mitchell L | $160,000 | None Available | |
| Hopp Tiffaney | $152,000 | None Available |
Source: Public Records
Mortgage History
| Date | Status | Borrower | Loan Amount |
|---|---|---|---|
| Previous Owner | Hopp Tiffaney | $147,343 |
Source: Public Records
Tax History
| Year | Tax Paid | Tax Assessment Tax Assessment Total Assessment is a certain percentage of the fair market value that is determined by local assessors to be the total taxable value of land and additions on the property. | Land | Improvement |
|---|---|---|---|---|
| 2025 | $2,562 | $159,500 | $28,800 | $130,700 |
| 2024 | $2,562 | $140,700 | $25,000 | $115,700 |
| 2023 | $2,598 | $140,700 | $25,000 | $115,700 |
| 2022 | $2,576 | $119,100 | $21,700 | $97,400 |
| 2021 | $2,396 | $119,100 | $21,700 | $97,400 |
| 2020 | $2,484 | $104,600 | $18,900 | $85,700 |
| 2019 | $2,254 | $104,600 | $18,900 | $85,700 |
| 2018 | $2,226 | $92,400 | $16,400 | $76,000 |
| 2017 | $2,066 | $92,400 | $16,400 | $76,000 |
| 2016 | $2,238 | $84,900 | $14,800 | $70,100 |
| 2015 | $2,238 | $84,900 | $14,800 | $70,100 |
| 2014 | $2,256 | $88,100 | $15,000 | $73,100 |
Source: Public Records
Map
Nearby Homes
Your Personal Tour Guide
Ask me questions while you tour the home.