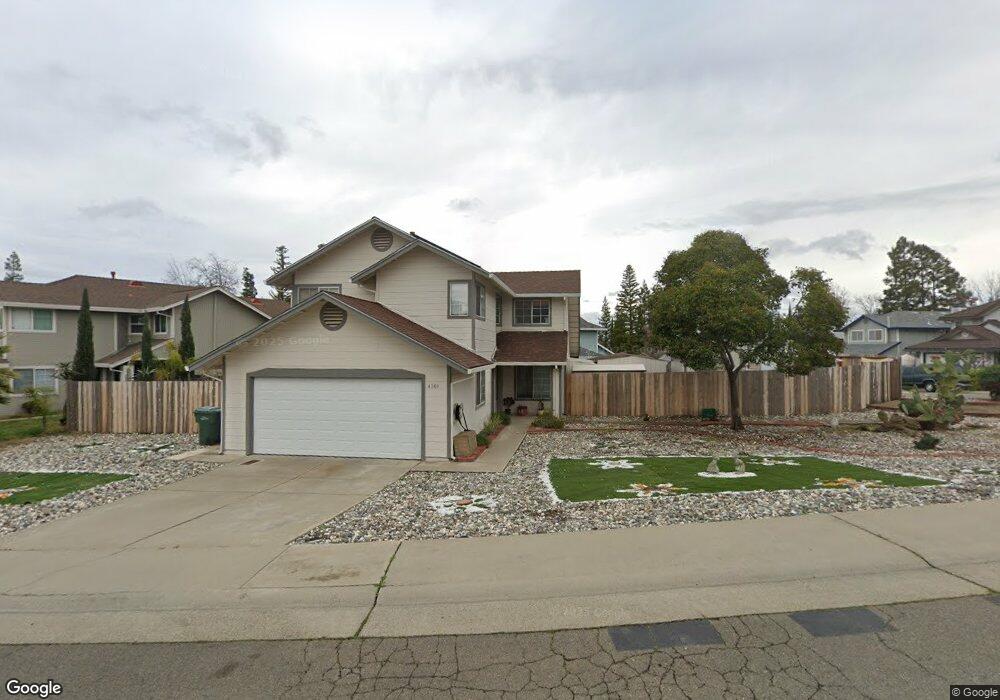
4101 Cedar Meadow Dr Antelope, CA 95843
Estimated Value: $403,000 - $593,000
4
Beds
3
Baths
1,992
Sq Ft
$259/Sq Ft
Est. Value
About This Home
This home is located at 4101 Cedar Meadow Dr, Antelope, CA 95843 and is currently estimated at $515,454, approximately $258 per square foot. 4101 Cedar Meadow Dr is a home located in Sacramento County with nearby schools including Oak Hill Elementary School, Wilson C. Riles Middle School, and Center High School.
Ownership History
Date
Name
Owned For
Owner Type
Purchase Details
Closed on
May 15, 2017
Sold by
Chen Chang Ting Chi and Chen Chang Kung Pei
Bought by
Chang Family Trust
Current Estimated Value
Purchase Details
Closed on
Jun 3, 2016
Sold by
Chen Chang Ting Chi and Chen Chang Kung Pei
Bought by
Chen Chang Ting Chi and Chen Chang Kung Pei
Home Financials for this Owner
Home Financials are based on the most recent Mortgage that was taken out on this home.
Original Mortgage
$405,000
Outstanding Balance
$328,689
Interest Rate
4.19%
Mortgage Type
Reverse Mortgage Home Equity Conversion Mortgage
Estimated Equity
$186,765
Purchase Details
Closed on
Feb 12, 2014
Sold by
Quantix Real Estate Group Llc
Bought by
Green Brian
Home Financials for this Owner
Home Financials are based on the most recent Mortgage that was taken out on this home.
Original Mortgage
$220,500
Interest Rate
4.47%
Mortgage Type
New Conventional
Create a Home Valuation Report for This Property
The Home Valuation Report is an in-depth analysis detailing your home's value as well as a comparison with similar homes in the area
Home Values in the Area
Average Home Value in this Area
Purchase History
| Date | Buyer | Sale Price | Title Company |
|---|---|---|---|
| Chang Family Trust | -- | None Available | |
| Chen Chang Ting Chi | -- | Title 365 | |
| Green Brian | $245,000 | Orange Coast Title Company |
Source: Public Records
Mortgage History
| Date | Status | Borrower | Loan Amount |
|---|---|---|---|
| Open | Chen Chang Ting Chi | $405,000 | |
| Closed | Chen Chang Ting Chi | $405,000 | |
| Closed | Green Brian | $220,500 |
Source: Public Records
Tax History
| Year | Tax Paid | Tax Assessment Tax Assessment Total Assessment is a certain percentage of the fair market value that is determined by local assessors to be the total taxable value of land and additions on the property. | Land | Improvement |
|---|---|---|---|---|
| 2025 | $3,760 | $324,635 | $63,111 | $261,524 |
| 2024 | $3,760 | $318,271 | $61,874 | $256,397 |
| 2023 | $3,678 | $312,031 | $60,661 | $251,370 |
| 2022 | $3,645 | $305,914 | $59,472 | $246,442 |
| 2021 | $3,741 | $299,916 | $58,306 | $241,610 |
| 2020 | $4,030 | $296,842 | $57,709 | $239,133 |
| 2019 | $3,672 | $291,023 | $56,578 | $234,445 |
| 2018 | $3,587 | $285,318 | $55,469 | $229,849 |
| 2017 | $3,479 | $279,725 | $54,382 | $225,343 |
| 2016 | $3,413 | $274,241 | $53,316 | $220,925 |
| 2015 | $3,167 | $270,123 | $52,516 | $217,607 |
| 2014 | $3,232 | $264,833 | $51,488 | $213,345 |
Source: Public Records
Map
Nearby Homes
- 8256 Benjamin Dr
- 4115 Copper Hill Ct
- 4142 Lake Placid Ct
- 4246 Albertville Way
- 4009 Honey Rose Place
- 3941 Grey Livery Way
- 8233 Dalkeith Way
- 8434 Walerga Rd Unit 327
- 8121 Deer Spring Cir
- 4133 Singing Tree Way
- 8425 Morning Skye Way
- 8020 Walerga Rd Unit 3
- 8020 Walerga Rd Unit 1093
- 8625 Valley Rim Way
- 10100 Pixley Ct
- 10084 Pixley Ct
- 9129 Redwater Dr
- 728 Patton Dr
- 8304 Oakenshield Cir
- 418 Colin Kelly Dr
- 8329 Cypress Lake Ct
- 8326 Discovery Bay Ct
- 8335 Cypress Lake Ct
- 8330 Discovery Bay Ct
- 4104 Cedar Meadow Dr
- 8320 Cypress Lake Ct
- 4108 Cedar Meadow Dr
- 4100 Cedar Meadow Dr
- 8324 Cypress Lake Ct
- 4112 Cedar Meadow Dr
- 8336 Discovery Bay Ct
- 8339 Cypress Lake Ct
- 8328 Cypress Lake Ct
- 4116 Cedar Meadow Dr
- 8321 Discovery Bay Ct
- 8332 Cypress Lake Ct
- 8325 Discovery Bay Ct
- 8245 Silverside Dr
- 4121 Cedar Meadow Dr
- 8329 Discovery Bay Ct
Your Personal Tour Guide
Ask me questions while you tour the home.