D
Landlord's Agent in 2020
Don Golden
Golden Properties


Estimated Value: $25,119 - $233,000
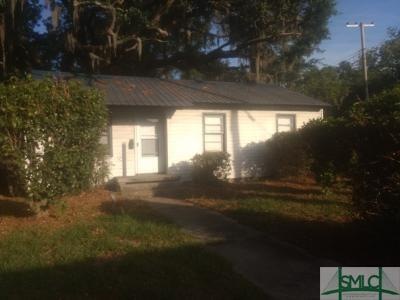
This home is located at 4101 Crane St, Savannah, GA 31405 since 11 May 2020 and is currently priced at $151,530. This property was built in 1947. 4101 Crane St is a home located in Chatham County with nearby schools including Haven Elementary School, Myers Middle School, and Beach High School.
Last Agent to Rent the Property
Don Golden
Golden Properties License #10730 Listed on: 05/11/2020
Last Renter's Agent
Don Golden
Golden Properties License #10730 Listed on: 05/11/2020
| Date | Buyer | Sale Price | Title Company |
|---|---|---|---|
| Avd Homes Llc | -- | -- | |
| Patel Vinay | $15,000 | -- | |
| Cox Cathy Waddell | -- | -- | |
| Cox Cathy Waddell | -- | -- | |
| Edwards Robbie | -- | -- |
| Date | Event | Price | List to Sale | Price per Sq Ft | Prior Sale |
|---|---|---|---|---|---|
| 09/11/2020 09/11/20 | Rented | $850 | -14.6% | -- | |
| 07/07/2020 07/07/20 | Under Contract | -- | -- | -- | |
| 05/11/2020 05/11/20 | For Rent | $995 | 0.0% | -- | |
| 01/20/2017 01/20/17 | Sold | $15,000 | -33.3% | $18 / Sq Ft | View Prior Sale |
| 12/21/2016 12/21/16 | Pending | -- | -- | -- | |
| 12/02/2016 12/02/16 | For Sale | $22,500 | -- | $27 / Sq Ft |
| Year | Tax Paid | Tax Assessment Tax Assessment Total Assessment is a certain percentage of the fair market value that is determined by local assessors to be the total taxable value of land and additions on the property. | Land | Improvement |
|---|---|---|---|---|
| 2025 | $960 | $19,520 | $7,920 | $11,600 |
| 2024 | $960 | $19,520 | $7,920 | $11,600 |
| 2023 | $202 | $16,520 | $7,920 | $8,600 |
| 2022 | $120 | $9,840 | $4,800 | $5,040 |
| 2021 | $477 | $8,080 | $3,840 | $4,240 |
| 2020 | $283 | $8,960 | $2,040 | $6,920 |
| 2019 | $398 | $8,960 | $2,040 | $6,920 |
| 2018 | $189 | $6,000 | $1,638 | $4,362 |
| 2017 | $476 | $16,240 | $1,880 | $14,360 |
| 2016 | $471 | $16,160 | $1,880 | $14,280 |
| 2015 | $796 | $19,080 | $1,880 | $17,200 |
| 2014 | $1,092 | $19,680 | $0 | $0 |
D
Landlord's Agent in 2020
Don Golden
Golden Properties

Seller's Agent in 2017
Dianne Kessler
TriCounty Real Estate LLC
(912) 663-2417
58 Total Sales
Buyer's Agent in 2017
John Sherrod
Keller Williams Coastal Area P
(912) 659-7864
4 Total Sales
Source: Savannah Multi-List Corporation
MLS Number: 223750
APN: 2009314001
Disclaimer: Certain information contained herein is derived from information provided by parties other than Homes.com. All information provided is deemed reliable, but is not guaranteed to be accurate and should be independently verified.
![]() IDX information is provided exclusively for personal, non-commercial use, and may not be used for any purpose other than to identify prospective properties consumers may be interested in purchasing.
IDX information is provided exclusively for personal, non-commercial use, and may not be used for any purpose other than to identify prospective properties consumers may be interested in purchasing.
Information is deemed reliable but not guaranteed.