Estimated Value: $740,406 - $789,000
3
Beds
2
Baths
1,651
Sq Ft
$466/Sq Ft
Est. Value
About This Home
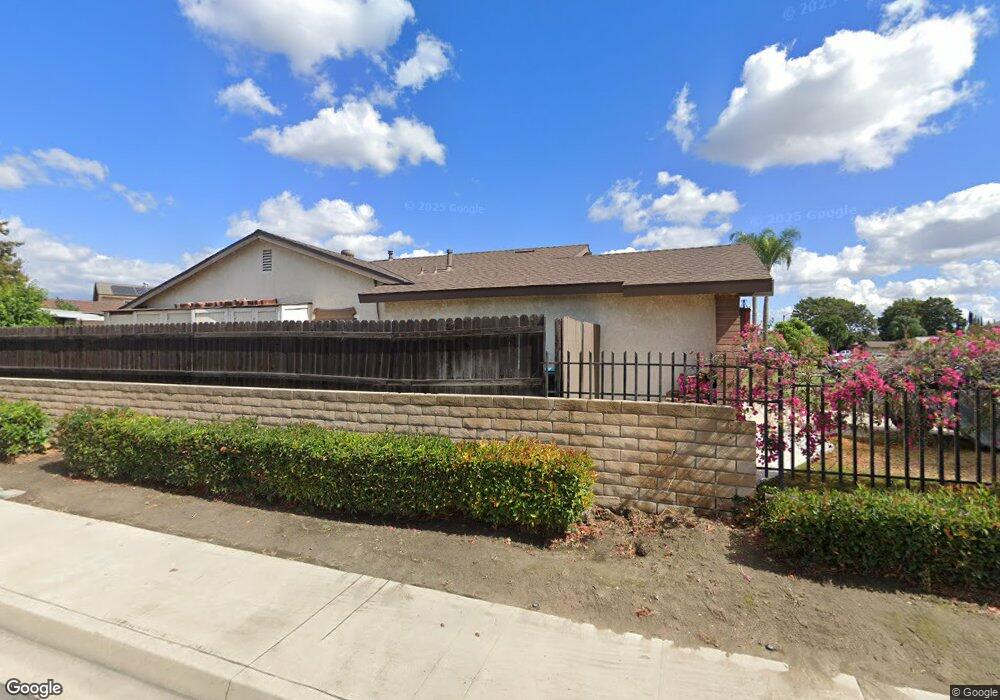
This home is located at 4102 Bernardo Ct, Chino, CA 91710 and is currently estimated at $768,852, approximately $465 per square foot. 4102 Bernardo Ct is a home located in San Bernardino County with nearby schools including Dickson Elementary, Ramona Junior High School, and Don Antonio Lugo High School.
Ownership History
Date
Name
Owned For
Owner Type
Purchase Details
Closed on
Jul 13, 2010
Sold by
Gonzalez Donald
Bought by
Gonzalez Donald Gerard and Gonzalez Samantha Anne
Current Estimated Value
Purchase Details
Closed on
Jan 14, 1999
Sold by
Washington Mutual Bank Fa
Bought by
Gonzalez Donald and Gonzalez Samantha
Home Financials for this Owner
Home Financials are based on the most recent Mortgage that was taken out on this home.
Original Mortgage
$155,956
Outstanding Balance
$36,266
Interest Rate
6.79%
Mortgage Type
FHA
Estimated Equity
$732,586
Purchase Details
Closed on
Jun 19, 1998
Sold by
Garver Timothy R and Garver Lori C Tr
Bought by
Washington Mutual Bank Fa
Purchase Details
Closed on
Sep 29, 1994
Sold by
Garver Timothy R
Bought by
Garver Timothy Robert and Garver Lori Carol
Create a Home Valuation Report for This Property
The Home Valuation Report is an in-depth analysis detailing your home's value as well as a comparison with similar homes in the area
Home Values in the Area
Average Home Value in this Area
Purchase History
| Date | Buyer | Sale Price | Title Company |
|---|---|---|---|
| Gonzalez Donald Gerard | -- | None Available | |
| Gonzalez Donald | $157,000 | Chicago Title Co | |
| Washington Mutual Bank Fa | $79,278 | Fidelity National Title Ins | |
| Garver Timothy Robert | -- | -- |
Source: Public Records
Mortgage History
| Date | Status | Borrower | Loan Amount |
|---|---|---|---|
| Open | Gonzalez Donald | $155,956 |
Source: Public Records
Tax History
| Year | Tax Paid | Tax Assessment Tax Assessment Total Assessment is a certain percentage of the fair market value that is determined by local assessors to be the total taxable value of land and additions on the property. | Land | Improvement |
|---|---|---|---|---|
| 2025 | $2,760 | $246,134 | $86,225 | $159,909 |
| 2024 | $2,687 | $241,308 | $84,534 | $156,774 |
| 2023 | $2,613 | $236,576 | $82,876 | $153,700 |
| 2022 | $2,598 | $231,937 | $81,251 | $150,686 |
| 2021 | $2,547 | $227,389 | $79,658 | $147,731 |
| 2020 | $2,514 | $225,057 | $78,841 | $146,216 |
| 2019 | $2,471 | $220,644 | $77,295 | $143,349 |
| 2018 | $2,417 | $216,317 | $75,779 | $140,538 |
| 2017 | $2,373 | $212,075 | $74,293 | $137,782 |
| 2016 | $2,219 | $207,916 | $72,836 | $135,080 |
| 2015 | $2,175 | $204,793 | $71,742 | $133,051 |
| 2014 | $2,132 | $200,782 | $70,337 | $130,445 |
Source: Public Records
Map
Nearby Homes
- 4115 Bernardo Ct
- 13144 Pipeline Ave
- 3927 Christina Rd
- 13148 Derby Ave
- 13140 Derby Ave
- 4621 Chino Ave
- 4182 Denali Ln
- 3508 Spur Ct
- 0 Norton Ave
- 13065 San Clemente Ln
- 4912 G St
- 13079 Monte Vista Ave
- 13257 2nd St
- 13239 2nd St
- 12818 Mckinley Ave
- 3260 Olympic View Dr
- 4152 Kennedy Ct
- 12608 Ramona Ave
- 13123 2nd St
- 13650 3rd St
- 4114 Bernardo Ct
- 4111 San Mateo St
- 4126 Bernardo Ct
- 4123 San Mateo St
- 4103 Bernardo Ct
- 13352 San Martin Place
- 4138 Bernardo Ct
- 4127 Bernardo Ct
- 4135 San Mateo St
- 4140 Bernardo Ct
- 4139 Bernardo Ct
- 13348 San Martin Place
- 4147 San Mateo St
- 4102 Miguel St
- 4118 Miguel St
- 4151 Bernardo Ct
- 4152 Bernardo Ct
- 4124 Miguel St
- 13347 San Martin Place
- 13336 San Martin Place
Your Personal Tour Guide
Ask me questions while you tour the home.