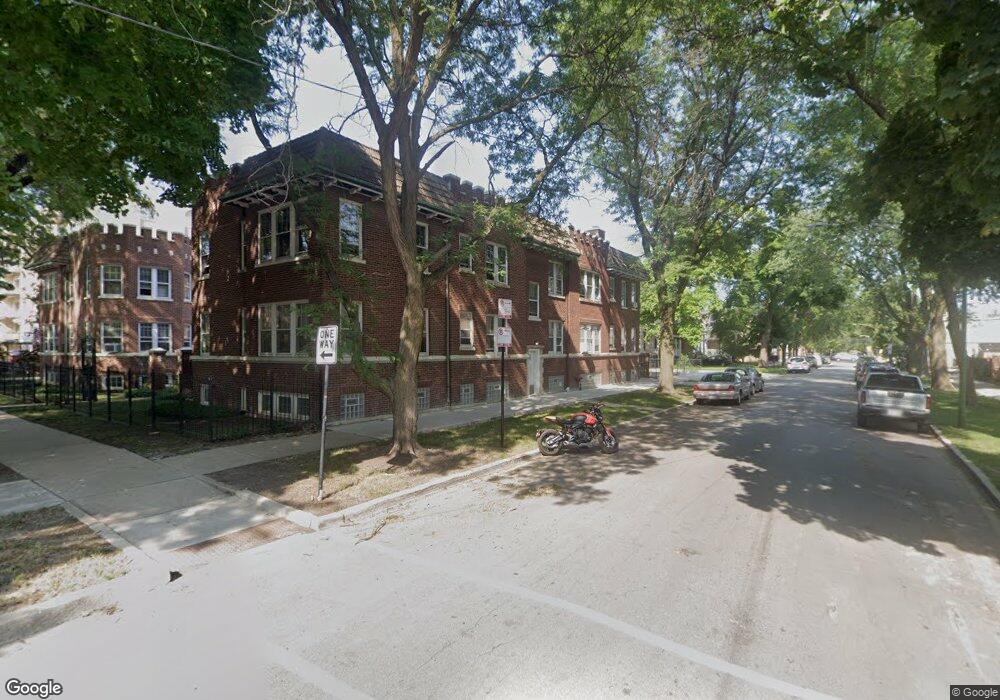
4103 N Keystone Ave Unit 41032 Chicago, IL 60641
Irving Park NeighborhoodEstimated Value: $169,000 - $204,000
--
Bed
--
Bath
17,400
Sq Ft
$11/Sq Ft
Est. Value
About This Home
This home is located at 4103 N Keystone Ave Unit 41032, Chicago, IL 60641 and is currently estimated at $188,417, approximately $10 per square foot. 4103 N Keystone Ave Unit 41032 is a home located in Cook County with nearby schools including Belding Elementary School, Schurz High School, and Gateway Montessori School.
Ownership History
Date
Name
Owned For
Owner Type
Purchase Details
Closed on
Mar 5, 2002
Sold by
Latourette Matthew E and Latourette Jennifer L
Bought by
Dougherty Roderick J
Current Estimated Value
Home Financials for this Owner
Home Financials are based on the most recent Mortgage that was taken out on this home.
Original Mortgage
$110,650
Outstanding Balance
$45,603
Interest Rate
6.87%
Estimated Equity
$142,814
Purchase Details
Closed on
Nov 24, 1999
Sold by
Keystone Court Condominiums Llc
Bought by
Latourette Matthew E and Latourette Jennifer L
Home Financials for this Owner
Home Financials are based on the most recent Mortgage that was taken out on this home.
Original Mortgage
$93,500
Interest Rate
8.02%
Create a Home Valuation Report for This Property
The Home Valuation Report is an in-depth analysis detailing your home's value as well as a comparison with similar homes in the area
Home Values in the Area
Average Home Value in this Area
Purchase History
| Date | Buyer | Sale Price | Title Company |
|---|---|---|---|
| Dougherty Roderick J | $116,500 | -- | |
| Latourette Matthew E | $104,000 | -- |
Source: Public Records
Mortgage History
| Date | Status | Borrower | Loan Amount |
|---|---|---|---|
| Open | Dougherty Roderick J | $110,650 | |
| Previous Owner | Latourette Matthew E | $93,500 |
Source: Public Records
Tax History Compared to Growth
Tax History
| Year | Tax Paid | Tax Assessment Tax Assessment Total Assessment is a certain percentage of the fair market value that is determined by local assessors to be the total taxable value of land and additions on the property. | Land | Improvement |
|---|---|---|---|---|
| 2024 | $1,627 | $15,371 | $3,167 | $12,204 |
| 2023 | $1,564 | $11,000 | $2,565 | $8,435 |
| 2022 | $1,564 | $11,000 | $2,565 | $8,435 |
| 2021 | $1,547 | $10,999 | $2,565 | $8,434 |
| 2020 | $1,493 | $9,783 | $1,282 | $8,501 |
| 2019 | $1,485 | $10,795 | $1,282 | $9,513 |
| 2018 | $1,458 | $10,795 | $1,282 | $9,513 |
| 2017 | $1,389 | $9,808 | $1,122 | $8,686 |
| 2016 | $1,469 | $9,808 | $1,122 | $8,686 |
| 2015 | $1,321 | $9,808 | $1,122 | $8,686 |
| 2014 | $1,267 | $9,372 | $962 | $8,410 |
| 2013 | $1,231 | $9,372 | $962 | $8,410 |
Source: Public Records
Map
Nearby Homes
- 4110 N Keystone Ave Unit 1N
- 4126 N Kedvale Ave Unit 302
- 4146 N Kedvale Ave Unit 1C
- 4239 N Keystone Ave Unit 3S
- 4243 N Keystone Ave Unit GN
- 4317 N Kedvale Ave
- 4156 N Elston Ave Unit 3N
- 4207 N Avers Ave
- 4342 N Kedvale Ave Unit 3C
- 4387 N Elston Ave
- 4101 W Montrose Ave
- 4115 N Ridgeway Ave
- 3856 N Kildare Ave
- 3826 N Hamlin Ave
- 3829 N Kildare Ave
- 4347 W Irving Park Rd
- 4103 N Lawndale Ave Unit 202
- 3811 N Kildare Ave
- 3816 W Montrose Ave
- 3707 W Cullom Ave Unit 1
- 4103 N Keystone Ave Unit 41031
- 4101 N Keystone Ave Unit 41012
- 4101 N Keystone Ave Unit 41011
- 4105 N Keystone Ave Unit 41052
- 4109 N Keystone Ave Unit 41092
- 4107 N Keystone Ave Unit 41072
- 4105 N Keystone Ave Unit 41051
- 4105 N Keystone Ave Unit 41051
- 4107 N Keystone Ave Unit 41071
- 4105 N Keystone Ave Unit 41052
- 4109 N Keystone Ave Unit 41091
- 4109 N Keystone Ave Unit 2
- 4107 N Keystone Ave Unit 2
- 4105 N Keystone Ave Unit 2B
- 4024 W Belle Plaine Ave
- 4022 W Belle Plaine Ave
- 4055 N Keystone Ave
- 4113 N Keystone Ave
- 4113 N Keystone Ave
- 4016 W Belle Plaine Ave