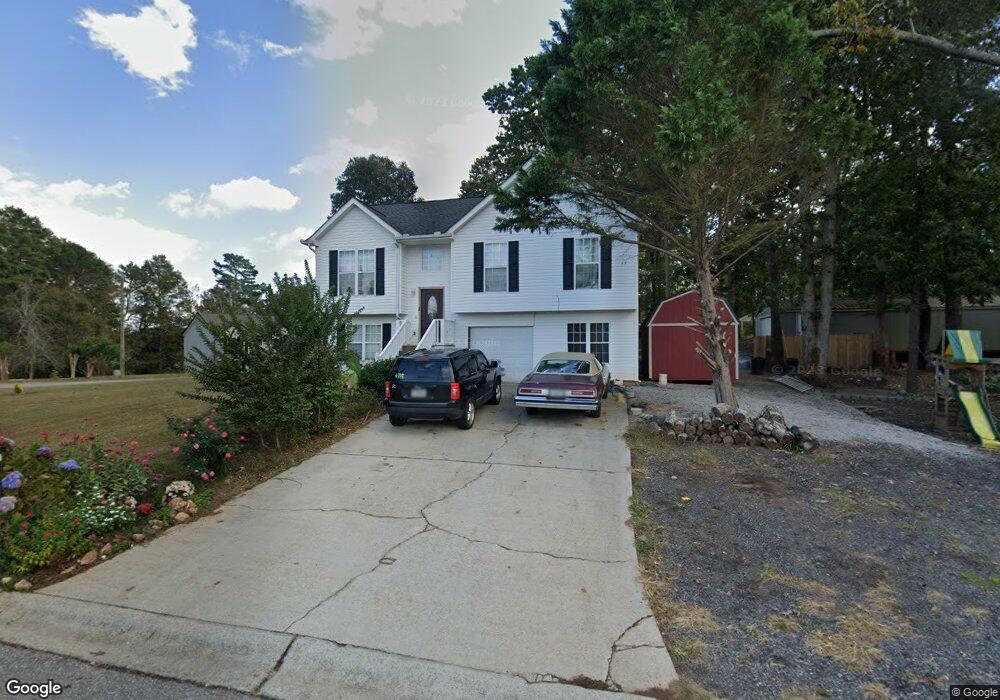
4103 Valley Glen Gainesville, GA 30507
Estimated Value: $286,000 - $305,000
3
Beds
2
Baths
1,206
Sq Ft
$244/Sq Ft
Est. Value
About This Home
This home is located at 4103 Valley Glen, Gainesville, GA 30507 and is currently estimated at $293,906, approximately $243 per square foot. 4103 Valley Glen is a home located in Hall County with nearby schools including Sugar Hill Elementary School, South Hall Middle School, and Johnson High School.
Ownership History
Date
Name
Owned For
Owner Type
Purchase Details
Closed on
Jul 6, 2007
Sold by
Garcia Yolanda
Bought by
Campos Vilma De Jesus
Current Estimated Value
Home Financials for this Owner
Home Financials are based on the most recent Mortgage that was taken out on this home.
Original Mortgage
$135,000
Outstanding Balance
$83,805
Interest Rate
6.37%
Mortgage Type
New Conventional
Estimated Equity
$210,101
Purchase Details
Closed on
Mar 20, 2003
Sold by
Garcia Yolanda
Bought by
Garcia Yolanda
Home Financials for this Owner
Home Financials are based on the most recent Mortgage that was taken out on this home.
Original Mortgage
$90,000
Interest Rate
5.82%
Mortgage Type
New Conventional
Purchase Details
Closed on
Feb 26, 2001
Sold by
Garcia Guadalupe
Bought by
Christancho Jorge H
Purchase Details
Closed on
Aug 18, 1998
Sold by
Cochran Broughton
Bought by
Sunrise Home Builders Inc
Create a Home Valuation Report for This Property
The Home Valuation Report is an in-depth analysis detailing your home's value as well as a comparison with similar homes in the area
Home Values in the Area
Average Home Value in this Area
Purchase History
| Date | Buyer | Sale Price | Title Company |
|---|---|---|---|
| Campos Vilma De Jesus | $135,000 | -- | |
| Garcia Yolanda | -- | -- | |
| Garcia Yolanda | $90,000 | -- | |
| Christancho Jorge H | $87,900 | -- | |
| Christancho Jorge H | $87,800 | -- | |
| Sunrise Home Builders Inc | $72,000 | -- |
Source: Public Records
Mortgage History
| Date | Status | Borrower | Loan Amount |
|---|---|---|---|
| Open | Campos Vilma De Jesus | $135,000 | |
| Previous Owner | Garcia Yolanda | $90,000 |
Source: Public Records
Tax History Compared to Growth
Tax History
| Year | Tax Paid | Tax Assessment Tax Assessment Total Assessment is a certain percentage of the fair market value that is determined by local assessors to be the total taxable value of land and additions on the property. | Land | Improvement |
|---|---|---|---|---|
| 2024 | $2,682 | $104,960 | $11,680 | $93,280 |
| 2023 | $2,289 | $104,920 | $11,680 | $93,240 |
| 2022 | $2,051 | $76,400 | $11,680 | $64,720 |
| 2021 | $2,086 | $76,360 | $11,680 | $64,680 |
| 2020 | $1,801 | $63,680 | $6,120 | $57,560 |
| 2019 | $1,580 | $55,040 | $6,120 | $48,920 |
| 2018 | $1,547 | $52,160 | $6,120 | $46,040 |
| 2017 | $1,279 | $43,120 | $6,120 | $37,000 |
| 2016 | $798 | $26,480 | $3,880 | $22,600 |
| 2015 | $801 | $26,480 | $3,880 | $22,600 |
| 2014 | $801 | $26,480 | $3,880 | $22,600 |
Source: Public Records
Map
Nearby Homes
- 3358 Pennington Point Dr
- 2997 Burton Cir
- 3501 Silver Wood Walk
- 3520 Silver Mist Cir
- 3457 Silver Chase Ct
- 2942 Salinger Way
- 3300 Athens Hwy
- 3738 Harmony Church Rd
- 2860 Jack Bryant Cir
- 2967 Maverick Trail
- 2811 Athens Hwy
- 2709 Squires Rd
- 3185 Athens Hwy
- 4390 Campbell Rd
- 4239 Mangum Mill Rd
- 3119 Gillsville Hwy
- 3188 Baker Rd
- 0 Baker Rd Unit 7640546
- 0 Baker Rd Unit 10593702
- 0 Valley Glen Dr Unit 7111831
- 0 Valley Glen Dr Unit 8767633
- 0 Valley Glen Dr Unit 8659982
- 0 Valley Glen Dr Unit 8670411
- 0 Valley Glen Dr Unit 8479228
- 0 Valley Glen Dr Unit 8411732
- 0 Valley Glen Dr Unit 8303044
- 0 Valley Glen Dr Unit 8143208
- 0 Valley Glen Dr Unit 8472764
- 4010 Glen Ridge
- 4111 Valley Glen
- 4007 Glen Ridge
- 4106 Valley Glen
- 4002 Glen Ridge
- 4014 Glen Ridge
- 4014 Glen Ridge
- 4003 Glen Ridge
- 4015 Glen Ridge
- 4110 Valley Glen
- 4016 Glen Ridge