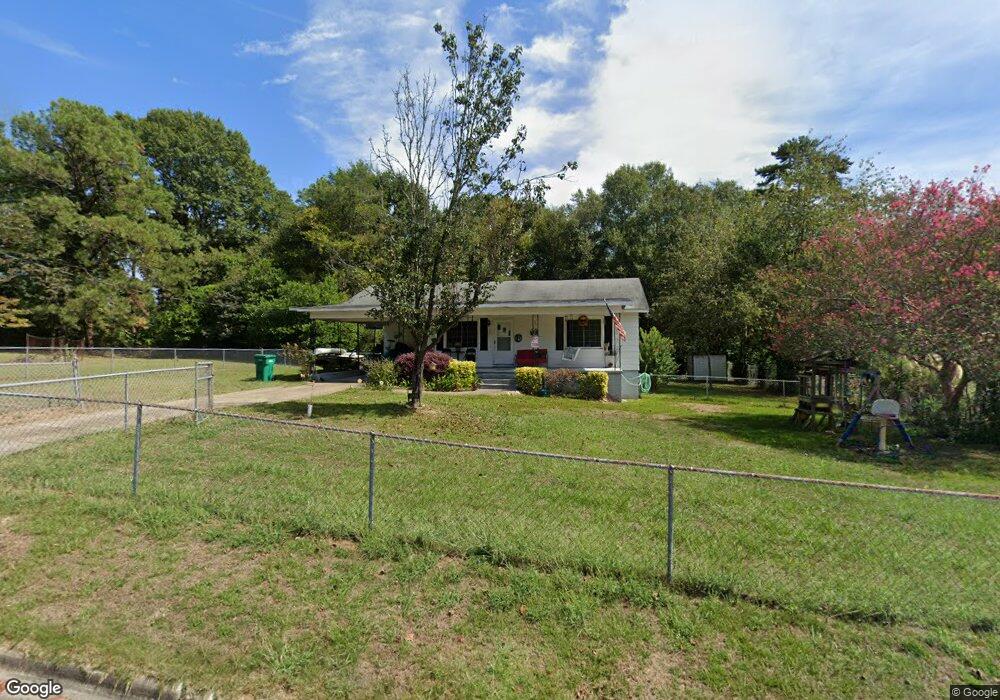
4104 13th Ave Phenix City, AL 36867
Estimated Value: $144,971 - $161,000
--
Bed
--
Bath
1,188
Sq Ft
$131/Sq Ft
Est. Value
About This Home
This home is located at 4104 13th Ave, Phenix City, AL 36867 and is currently estimated at $155,243, approximately $130 per square foot. 4104 13th Ave is a home located in Russell County with nearby schools including Sherwood Elementary School, Phenix City Intermediate School, and South Girard School.
Ownership History
Date
Name
Owned For
Owner Type
Purchase Details
Closed on
Aug 24, 2012
Sold by
Corbett Steven W
Bought by
Fowler Marilyn N
Current Estimated Value
Home Financials for this Owner
Home Financials are based on the most recent Mortgage that was taken out on this home.
Original Mortgage
$77,000
Outstanding Balance
$55,495
Interest Rate
4.55%
Mortgage Type
New Conventional
Estimated Equity
$99,749
Purchase Details
Closed on
Feb 23, 2012
Sold by
Laschober James D
Bought by
Corbett Steven W
Home Financials for this Owner
Home Financials are based on the most recent Mortgage that was taken out on this home.
Original Mortgage
$45,000
Interest Rate
4%
Mortgage Type
New Conventional
Purchase Details
Closed on
May 18, 2011
Sold by
Laschober James D and Lashober Laurie S
Bought by
Laschober James D
Home Financials for this Owner
Home Financials are based on the most recent Mortgage that was taken out on this home.
Original Mortgage
$61,637
Interest Rate
4.79%
Create a Home Valuation Report for This Property
The Home Valuation Report is an in-depth analysis detailing your home's value as well as a comparison with similar homes in the area
Home Values in the Area
Average Home Value in this Area
Purchase History
| Date | Buyer | Sale Price | Title Company |
|---|---|---|---|
| Fowler Marilyn N | -- | -- | |
| Corbett Steven W | -- | -- | |
| Laschober James D | -- | -- |
Source: Public Records
Mortgage History
| Date | Status | Borrower | Loan Amount |
|---|---|---|---|
| Open | Fowler Marilyn N | $77,000 | |
| Previous Owner | Corbett Steven W | $45,000 | |
| Previous Owner | Laschober James D | $61,637 |
Source: Public Records
Tax History Compared to Growth
Tax History
| Year | Tax Paid | Tax Assessment Tax Assessment Total Assessment is a certain percentage of the fair market value that is determined by local assessors to be the total taxable value of land and additions on the property. | Land | Improvement |
|---|---|---|---|---|
| 2024 | $621 | $11,780 | $3,000 | $8,780 |
| 2023 | $582 | $11,120 | $3,000 | $8,120 |
| 2022 | $496 | $9,664 | $2,680 | $6,984 |
| 2021 | $449 | $8,869 | $2,680 | $6,189 |
| 2020 | $419 | $8,360 | $2,680 | $5,680 |
| 2019 | $326 | $6,780 | $1,440 | $5,340 |
| 2018 | $308 | $6,480 | $1,440 | $5,040 |
| 2017 | $297 | $6,280 | $1,440 | $4,840 |
| 2016 | $297 | $6,280 | $1,440 | $4,840 |
| 2015 | $285 | $6,088 | $1,365 | $4,723 |
| 2014 | $285 | $6,088 | $1,365 | $4,723 |
Source: Public Records
Map
Nearby Homes