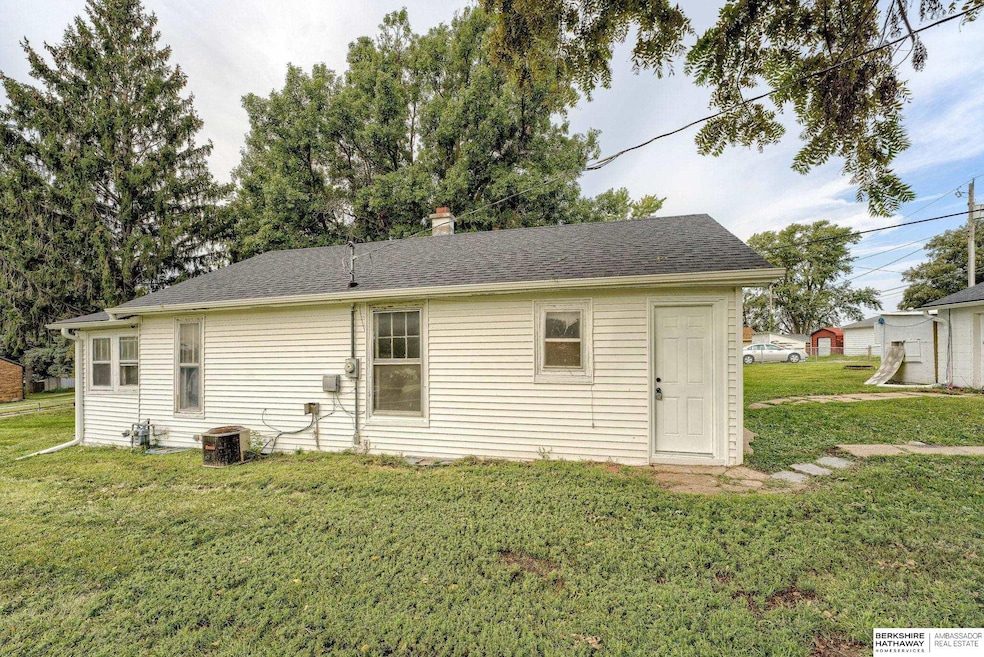
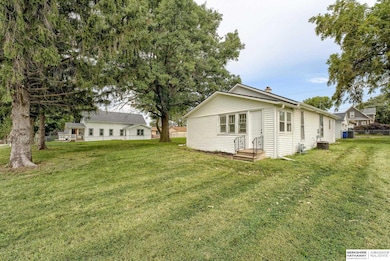
4104 Y St Omaha, NE 68107
South Central Omaha NeighborhoodEstimated payment $1,275/month
Highlights
- Ranch Style House
- 2 Car Detached Garage
- Forced Air Heating and Cooling System
- No HOA
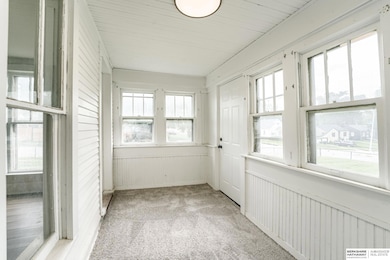
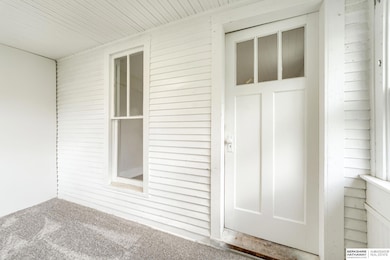
- Enclosed Patio or Porch
- 3-minute walk to Morton Park
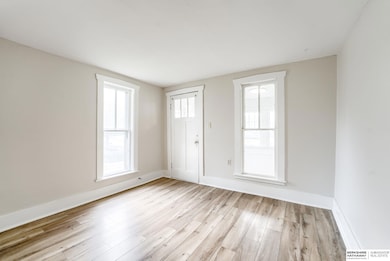
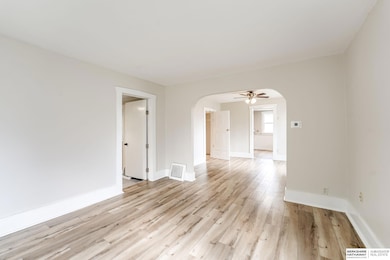
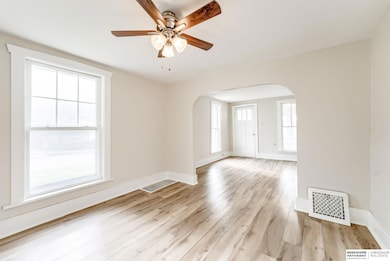
About This Home
Move-in ready ranch-style home featuring 3 bedrooms, 1 bathroom, and a 2-car detached garage, all situated on an oversized double lot! This property boasts fresh updates throughout, making it the perfect blend of comfort and convenience. Don't miss out—schedule your showing today!
Home Details
Home Type
- Single Family
Est. Annual Taxes
- $1,354
Year Built
- Built in 1910
Lot Details
- 6,534 Sq Ft Lot
- Lot Dimensions are 131 x 50
- Chain Link Fence
Parking
- 2 Car Detached Garage
Home Design
- Ranch Style House
- Block Foundation
- Composition Roof
Kitchen
- Oven or Range
- Microwave
- Disposal
Bedrooms and Bathrooms
- 3 Bedrooms
- 1 Full Bathroom
Outdoor Features
- Enclosed Patio or Porch
Schools
- Indian Hill Elementary School
- Bryan Middle School
- Bryan High School
Utilities
- Forced Air Heating and Cooling System
- Heating System Uses Natural Gas
Additional Features
- Unfinished Basement
Community Details
- No Home Owners Association
- Corrigan Place 1St Add Subdivision
Listing and Financial Details
- Assessor Parcel Number 0834200004
Map
Home Values in the Area
Average Home Value in this Area
Tax History
| Year | Tax Paid | Tax Assessment Tax Assessment Total Assessment is a certain percentage of the fair market value that is determined by local assessors to be the total taxable value of land and additions on the property. | Land | Improvement |
|---|---|---|---|---|
| 2025 | $1,354 | $90,100 | $12,200 | $77,900 |
| 2024 | $1,766 | $83,700 | $12,200 | $71,500 |
| 2023 | $1,766 | $83,700 | $12,200 | $71,500 |
| 2022 | $1,652 | $77,400 | $6,400 | $71,000 |
| 2021 | $1,499 | $70,800 | $6,400 | $64,400 |
| 2020 | $1,516 | $70,800 | $6,400 | $64,400 |
| 2019 | $1,325 | $61,700 | $6,400 | $55,300 |
| 2018 | $1,288 | $59,900 | $6,400 | $53,500 |
| 2017 | $1,285 | $59,900 | $6,400 | $53,500 |
| 2016 | $1,285 | $59,900 | $6,400 | $53,500 |
| 2015 | $1,268 | $59,900 | $6,400 | $53,500 |
| 2014 | $1,268 | $59,900 | $6,400 | $53,500 |
Property History
| Date | Event | Price | List to Sale | Price per Sq Ft |
|---|---|---|---|---|
| 11/10/2025 11/10/25 | Price Changed | $220,000 | -2.2% | $170 / Sq Ft |
| 09/04/2025 09/04/25 | For Sale | $225,000 | -- | $174 / Sq Ft |
Purchase History
| Date | Type | Sale Price | Title Company |
|---|---|---|---|
| Warranty Deed | $75,000 | Galaxy Title | |
| Quit Claim Deed | -- | Galaxy Title |
Mortgage History
| Date | Status | Loan Amount | Loan Type |
|---|---|---|---|
| Open | $3,000,000 | Credit Line Revolving |
Source: Great Plains Regional MLS
MLS Number: 22525350
APN: 3420-0004-08
Disclaimer: Certain information contained herein is derived from information provided by parties other than Homes.com. All information provided is deemed reliable, but is not guaranteed to be accurate and should be independently verified.
![]() Listing information is provided by Participants of the Great Plains Regional Multiple Listing Service Inc.
Listing information is provided by Participants of the Great Plains Regional Multiple Listing Service Inc.
IDX information is provided exclusively for personal, non-commercial use, and may not be used for any purpose other than to identify prospective properties consumers may be interested in purchasing.
Information is deemed reliable but not guaranteed.
Copyright 2025, Great Plains Regional MLS LLC
- 5401 S 32nd St Unit 2
- 3306 Gertrude St
- 7220 Blue Ridge Dr
- 4920 S 30th St
- 2521 Jefferson St
- 5323 P St
- 4824 Glasgow Ave
- 6006 S 20th Ave
- 7201 S 22nd St
- 4701 Schroeder Dr
- 1802 Chandler Rd W Unit 1
- 1802 Chandler Rd W Unit 1
- 5009 A St
- 4129 Valley St
- 5068 Grover St
- 3224 S 32nd Ave
- 3084 S 40th St
- 5444 Grover St
- 7425 S 69th St
- 2462 S 38th Ave
