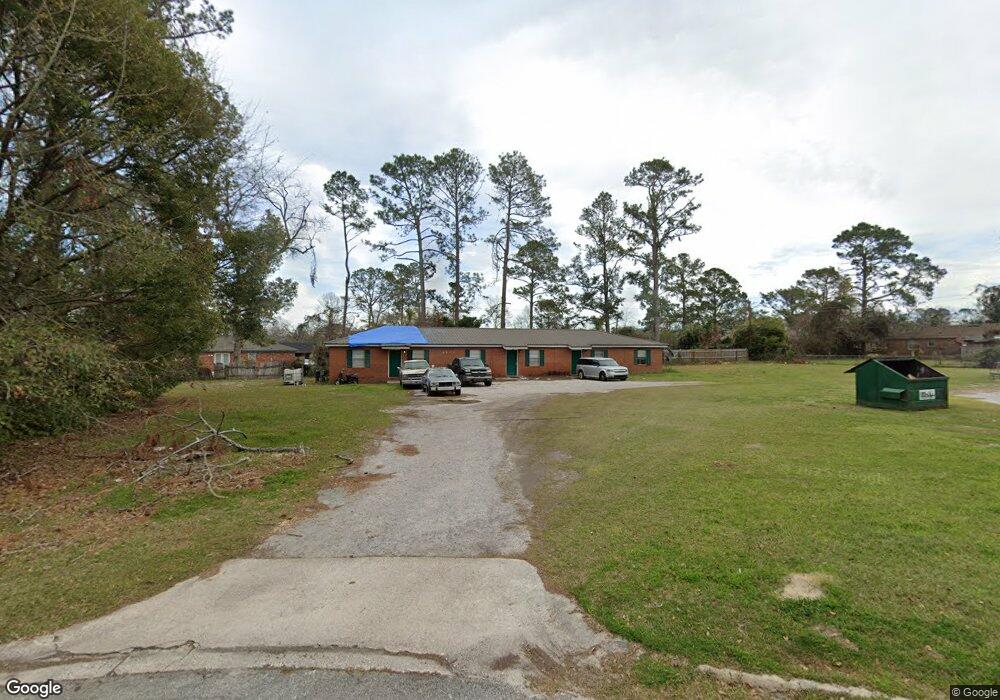
4106 Empress Place Valdosta, GA 31605
Estimated Value: $207,000 - $223,000
6
Beds
3
Baths
2,548
Sq Ft
$84/Sq Ft
Est. Value
About This Home
This home is located at 4106 Empress Place, Valdosta, GA 31605 and is currently estimated at $215,000, approximately $84 per square foot. 4106 Empress Place is a home located in Lowndes County with nearby schools including Dewar Elementary School, Pine Grove Middle School, and Lowndes High School.
Ownership History
Date
Name
Owned For
Owner Type
Purchase Details
Closed on
Jun 16, 2017
Sold by
Not Provided
Bought by
Houser Investment Properties L
Current Estimated Value
Home Financials for this Owner
Home Financials are based on the most recent Mortgage that was taken out on this home.
Original Mortgage
$90,863
Interest Rate
4.02%
Mortgage Type
New Conventional
Purchase Details
Closed on
Apr 11, 2008
Sold by
Houser Investment Properties
Bought by
Mjs Utility & Investments Llc
Purchase Details
Closed on
Oct 16, 2001
Sold by
Blevins John E
Bought by
Houser Investment Properties
Purchase Details
Closed on
May 25, 1974
Bought by
Blevins John E
Purchase Details
Closed on
Aug 9, 1971
Bought by
Blevins John E Etal
Purchase Details
Closed on
Mar 17, 1971
Bought by
Minchew Gary
Create a Home Valuation Report for This Property
The Home Valuation Report is an in-depth analysis detailing your home's value as well as a comparison with similar homes in the area
Home Values in the Area
Average Home Value in this Area
Purchase History
| Date | Buyer | Sale Price | Title Company |
|---|---|---|---|
| Houser Investment Properties L | -- | -- | |
| Mjs Utility & Investments Llc | -- | -- | |
| Houser Investment Properties | $290,000 | -- | |
| Blevins John E | $4,300 | -- | |
| Blevins John E Etal | $28,000 | -- | |
| Minchew Gary | $3,500 | -- |
Source: Public Records
Mortgage History
| Date | Status | Borrower | Loan Amount |
|---|---|---|---|
| Closed | Houser Investment Properties L | $90,863 |
Source: Public Records
Tax History Compared to Growth
Tax History
| Year | Tax Paid | Tax Assessment Tax Assessment Total Assessment is a certain percentage of the fair market value that is determined by local assessors to be the total taxable value of land and additions on the property. | Land | Improvement |
|---|---|---|---|---|
| 2024 | $1,438 | $58,691 | $9,138 | $49,553 |
| 2023 | $1,438 | $58,691 | $9,138 | $49,553 |
| 2022 | $1,009 | $34,831 | $9,138 | $25,693 |
| 2021 | $1,052 | $34,831 | $9,138 | $25,693 |
| 2020 | $979 | $34,831 | $9,138 | $25,693 |
| 2019 | $989 | $34,831 | $9,138 | $25,693 |
| 2018 | $999 | $34,831 | $9,138 | $25,693 |
| 2017 | $1,007 | $34,831 | $9,138 | $25,693 |
| 2016 | $1,010 | $34,831 | $9,138 | $25,693 |
| 2015 | $969 | $34,831 | $9,138 | $25,693 |
| 2014 | $988 | $34,831 | $9,138 | $25,693 |
Source: Public Records
Map
Nearby Homes
- 4111 Oak Dr
- 4114 Oak Dr Unit 8
- 3918 Camellia Dr
- 5026 Greyfield Place N
- 383 Camellia Dr
- 3480 Bemiss Rd
- 3448 Bemiss Rd
- 4475 Bemiss Rd
- 1.39 ac. Bemiss Rd
- 4010 Fritz Ln
- 3604 Bellhaven Dr
- 3504 Breckland Dr
- 102 Starmount Dr
- 646 Justin Dr
- 3917 Pecan Dr
- 309 Tomlinson Dr
- 618 Justin Dr
- 115 Brookview Terrace
- 3903 Pecan Dr
- 4004 Tack Trail
- 4109 Oak Dr
- 4107 Oak Dr
- 4022 Camellia Dr Unit A & B
- 4022 Camellia Dr
- 4014 Birch St
- 4018 Birch St
- 4020 Camellia Dr
- 4014 Camellia Dr
- 9126 Torrington Ln
- 9118 Torrington Ln
- 9117 Torrington Ln
- 9113 Torrington Ln
- 9121 Torrington Ln
- 2068 Meadow Cove Dr
- 2056 Meadow Cove Dr
- 9137 Torrington Ln
- 9133 Torrington Ln
- 9129 Torrington Ln
- 2060 Meadow Cove Dr
- 2052 Meadow Cove Dr