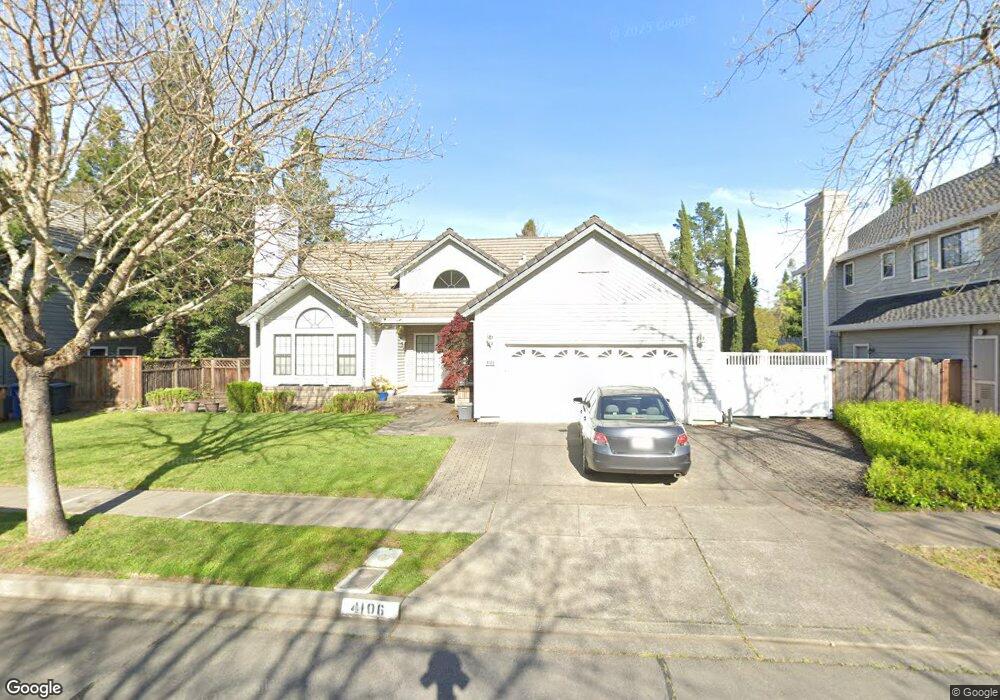
4106 Foxridge Way Napa, CA 94558
Browns Valley NeighborhoodEstimated Value: $1,248,000 - $1,459,000
3
Beds
3
Baths
2,423
Sq Ft
$551/Sq Ft
Est. Value
About This Home
This home is located at 4106 Foxridge Way, Napa, CA 94558 and is currently estimated at $1,334,760, approximately $550 per square foot. 4106 Foxridge Way is a home located in Napa County with nearby schools including Browns Valley Elementary School, Harvest Middle School, and Napa High School.
Ownership History
Date
Name
Owned For
Owner Type
Purchase Details
Closed on
Sep 17, 2013
Sold by
Mccall George and Mccall Millie G
Bought by
Higgins Joseph William and Higgins Kathie May
Current Estimated Value
Purchase Details
Closed on
Oct 12, 2003
Sold by
Barde Larry M and Barde Marie B
Bought by
Mccall George and Mccall Millie G
Home Financials for this Owner
Home Financials are based on the most recent Mortgage that was taken out on this home.
Original Mortgage
$517,500
Interest Rate
3.64%
Mortgage Type
Negative Amortization
Purchase Details
Closed on
Mar 20, 2000
Sold by
Gee Valerie K
Bought by
Barde Larry M and Barde Marie B
Home Financials for this Owner
Home Financials are based on the most recent Mortgage that was taken out on this home.
Original Mortgage
$344,000
Interest Rate
7.75%
Purchase Details
Closed on
Jun 1, 1996
Sold by
Gee Peter and Gee Valerie K
Bought by
Gee Valerie K
Create a Home Valuation Report for This Property
The Home Valuation Report is an in-depth analysis detailing your home's value as well as a comparison with similar homes in the area
Home Values in the Area
Average Home Value in this Area
Purchase History
| Date | Buyer | Sale Price | Title Company |
|---|---|---|---|
| Higgins Joseph William | $761,500 | North American Title Company | |
| Mccall George | $690,000 | Napa Land Title Company | |
| Barde Larry M | $430,000 | Napa Land Title Company | |
| Gee Valerie K | -- | -- |
Source: Public Records
Mortgage History
| Date | Status | Borrower | Loan Amount |
|---|---|---|---|
| Previous Owner | Mccall George | $517,500 | |
| Previous Owner | Barde Larry M | $344,000 |
Source: Public Records
Tax History Compared to Growth
Tax History
| Year | Tax Paid | Tax Assessment Tax Assessment Total Assessment is a certain percentage of the fair market value that is determined by local assessors to be the total taxable value of land and additions on the property. | Land | Improvement |
|---|---|---|---|---|
| 2025 | $11,004 | $933,422 | $367,754 | $565,668 |
| 2024 | $11,004 | $915,121 | $360,544 | $554,577 |
| 2023 | $11,004 | $897,178 | $353,475 | $543,703 |
| 2022 | $10,671 | $879,588 | $346,545 | $533,043 |
| 2021 | $10,522 | $862,342 | $339,750 | $522,592 |
| 2020 | $10,446 | $853,501 | $336,267 | $517,234 |
| 2019 | $10,238 | $836,767 | $329,674 | $507,093 |
| 2018 | $10,113 | $820,360 | $323,210 | $497,150 |
| 2017 | $9,925 | $804,275 | $316,873 | $487,402 |
| 2016 | $9,768 | $788,506 | $310,660 | $477,846 |
| 2015 | $9,165 | $776,663 | $305,994 | $470,669 |
| 2014 | $9,032 | $761,450 | $300,000 | $461,450 |
Source: Public Records
Map
Nearby Homes
- 18 Tuscany Ct
- 115 Waterstone Ct
- 3493 Westminster Way
- 2890 Redwood Rd
- 4085 Sutro Dr
- 3051 Redwood Rd
- 4048 Browns Valley Rd
- 1060 Borrette Ln
- 1152 Stanford Ct
- 35 Forest Ln
- Homesite Two Plan at Western Meadows
- Homesite Three Plan at Western Meadows
- Homesite Four Plan at Western Meadows
- Homesite Six Plan at Western Meadows
- Homesite Eight Plan at Western Meadows
- 4022 Browns Valley Rd
- 3344 Linda Mesa Way
- 1100 Borrette Ln
- 1080 Borrette Ln
- 1070 Borrette Ln
- 4112 Foxridge Way
- 4100 Foxridge Way
- 4118 Foxridge Way
- 3502 Hunters Cir
- 3561 Hunters Cir
- 4152 Browns Valley Rd
- 4170 Browns Valley Rd
- 3508 Hunters Cir
- 4190 Browns Valley Rd
- 3567 Hunters Cir
- 4124 Foxridge Way
- 4150 Browns Valley Rd
- 4049 Foxridge Way
- 4042 Foxridge Way
- 3556 Hunters Cir
- 2981 Redwood Rd
- 3562 Hunters Cir
- 2 Remington Ct
- 4043 Foxridge Way
- 3568 Hunters Cir