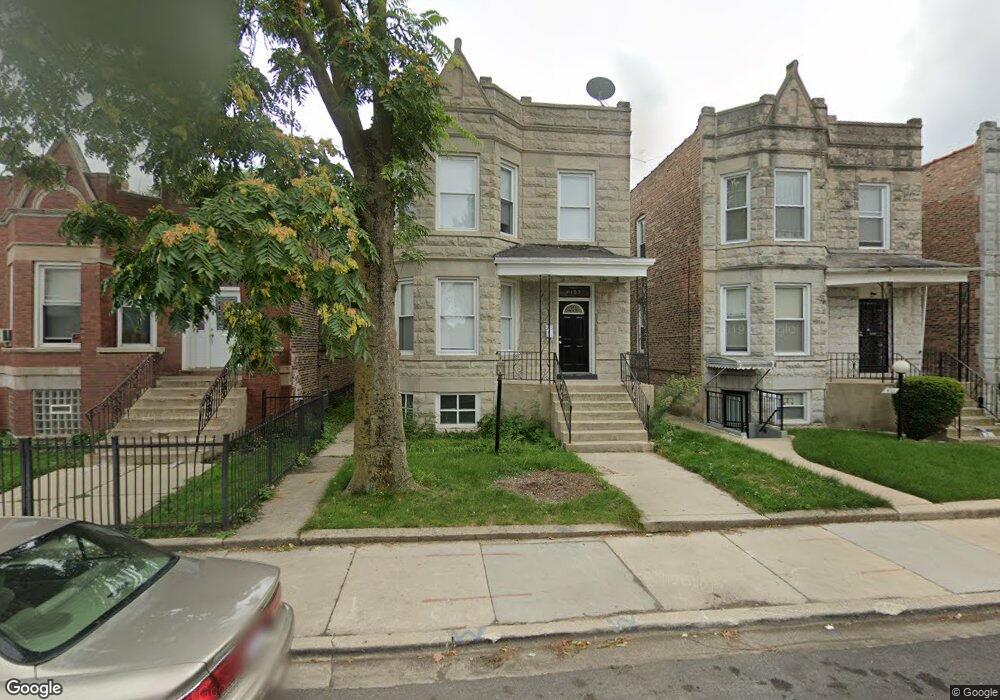
4107 W Cullerton St Unit 1 Chicago, IL 60623
North Lawndale NeighborhoodEstimated Value: $298,000 - $339,000
4
Beds
3
Baths
2,028
Sq Ft
$157/Sq Ft
Est. Value
About This Home
This home is located at 4107 W Cullerton St Unit 1, Chicago, IL 60623 and is currently estimated at $317,451, approximately $156 per square foot. 4107 W Cullerton St Unit 1 is a home located in Cook County with nearby schools including Mason Elementary School, KIPP Chicago Chrtrs - Ascend Acad, and Chicago West Side Christian School.
Ownership History
Date
Name
Owned For
Owner Type
Purchase Details
Closed on
Nov 12, 2018
Sold by
Morris Naeem
Bought by
Iniguez Jose De Jesus and Gutierez Maria Isabel
Current Estimated Value
Home Financials for this Owner
Home Financials are based on the most recent Mortgage that was taken out on this home.
Original Mortgage
$189,012
Outstanding Balance
$166,867
Interest Rate
5%
Mortgage Type
FHA
Estimated Equity
$150,584
Purchase Details
Closed on
Nov 13, 2017
Sold by
Us Bank Na
Bought by
Morris Naeem
Purchase Details
Closed on
Nov 25, 2014
Sold by
Freeman Anita
Bought by
U S Bank National Association
Purchase Details
Closed on
Aug 26, 2004
Sold by
Freeman Lorraine
Bought by
Freeman Anita
Home Financials for this Owner
Home Financials are based on the most recent Mortgage that was taken out on this home.
Original Mortgage
$176,000
Interest Rate
8.4%
Mortgage Type
Commercial
Create a Home Valuation Report for This Property
The Home Valuation Report is an in-depth analysis detailing your home's value as well as a comparison with similar homes in the area
Home Values in the Area
Average Home Value in this Area
Purchase History
| Date | Buyer | Sale Price | Title Company |
|---|---|---|---|
| Iniguez Jose De Jesus | $192,500 | Stewart Title Company | |
| Morris Naeem | $47,000 | Old Republic Title | |
| U S Bank National Association | -- | None Available | |
| Freeman Anita | -- | Nations Title |
Source: Public Records
Mortgage History
| Date | Status | Borrower | Loan Amount |
|---|---|---|---|
| Open | Iniguez Jose De Jesus | $189,012 | |
| Previous Owner | Freeman Anita | $176,000 |
Source: Public Records
Tax History Compared to Growth
Tax History
| Year | Tax Paid | Tax Assessment Tax Assessment Total Assessment is a certain percentage of the fair market value that is determined by local assessors to be the total taxable value of land and additions on the property. | Land | Improvement |
|---|---|---|---|---|
| 2024 | $3,175 | $19,501 | $5,438 | $14,063 |
| 2023 | $3,096 | $15,000 | $4,406 | $10,594 |
| 2022 | $3,096 | $15,000 | $4,406 | $10,594 |
| 2021 | $3,026 | $14,999 | $4,406 | $10,593 |
| 2020 | $2,841 | $12,713 | $4,406 | $8,307 |
| 2019 | $2,848 | $14,126 | $4,406 | $9,720 |
| 2018 | $2,393 | $12,075 | $4,406 | $7,669 |
| 2017 | $2,448 | $14,709 | $3,937 | $10,772 |
| 2016 | $2,446 | $14,709 | $3,937 | $10,772 |
| 2015 | $2,215 | $14,709 | $3,937 | $10,772 |
| 2014 | $2,188 | $14,360 | $3,750 | $10,610 |
| 2013 | $2,134 | $14,360 | $3,750 | $10,610 |
Source: Public Records
Map
Nearby Homes
- 4037 W 21st St
- 1825 S Komensky Ave
- 1855 S Komensky Ave
- 4014 W 21st St
- 2106 S Pulaski Rd
- 4122 W Cermak Rd
- 4022 W Cermak Rd
- 4242 W 21st Place
- 1526 S Keeler Ave
- 1524 S Keeler Ave
- 1431 S Keeler Ave
- 1418 S Keeler Ave
- 4209 W Cermak Rd
- 1818 S Harding Ave
- 1620 S Kedvale Ave
- 1625 S Keeler Ave
- 1840 S Springfield Ave
- 1241 S Kildare Ave
- 1404 S Kedvale Ave
- 1839 S Springfield Ave
- 4107 W Cullerton St
- 4111 W Cullerton St Unit 1
- 4105 W Cullerton St
- 4113 W Cullerton St Unit 12
- 4113 W Cullerton St
- 4101 W Cullerton St
- 4117 W Cullerton St Unit 1
- 4117 W Cullerton St
- 4119 W Cullerton St
- 4112 W Cullerton St
- 4108 W Cullerton St
- 4108 W Cullerton St Unit G
- 4108 W Cullerton St Unit 2
- 4106 W Cullerton St
- 4123 W Cullerton St
- 4100 W Cullerton St
- 4100 W Cullerton St
- 4057 W Cullerton St
- 4102 W Cullerton St