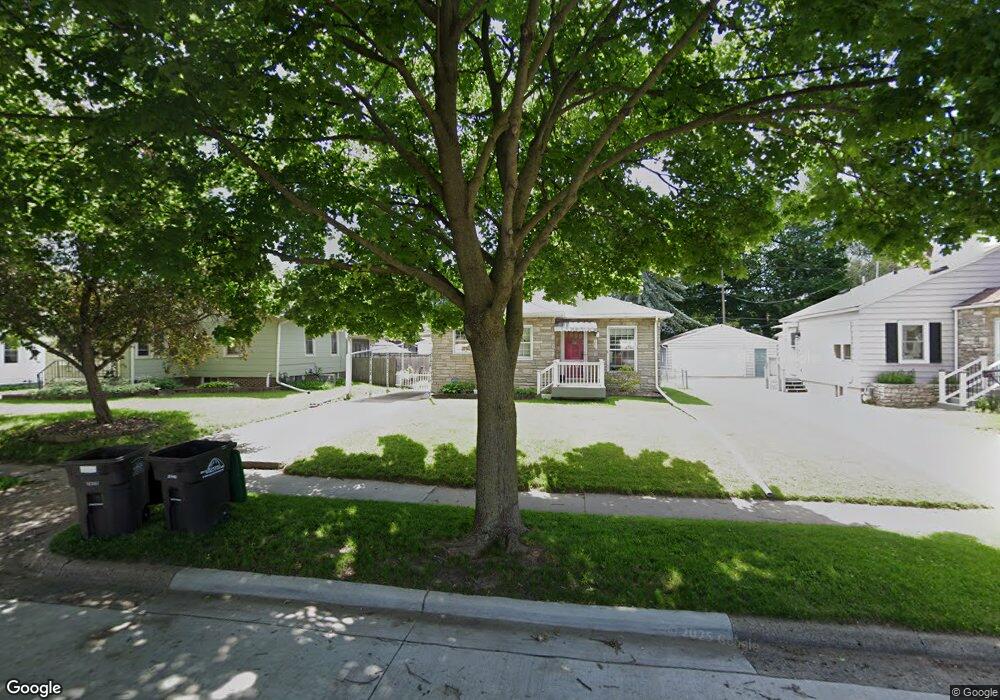
4108 1st St Des Moines, IA 50313
Highland Park NeighborhoodEstimated Value: $161,649 - $181,000
2
Beds
2
Baths
676
Sq Ft
$251/Sq Ft
Est. Value
About This Home
This home is located at 4108 1st St, Des Moines, IA 50313 and is currently estimated at $169,912, approximately $251 per square foot. 4108 1st St is a home located in Polk County with nearby schools including Madison Elementary School, Harding Middle School, and North High School.
Ownership History
Date
Name
Owned For
Owner Type
Purchase Details
Closed on
Apr 19, 2011
Sold by
Burns Harold and Burns Darlene
Bought by
Bowers Kenneth L
Current Estimated Value
Home Financials for this Owner
Home Financials are based on the most recent Mortgage that was taken out on this home.
Original Mortgage
$77,972
Outstanding Balance
$53,668
Interest Rate
4.75%
Mortgage Type
FHA
Estimated Equity
$116,244
Purchase Details
Closed on
Feb 21, 2002
Sold by
Hart Ralph and Hart Louise
Bought by
Finch Amanda
Home Financials for this Owner
Home Financials are based on the most recent Mortgage that was taken out on this home.
Original Mortgage
$70,913
Interest Rate
7.11%
Create a Home Valuation Report for This Property
The Home Valuation Report is an in-depth analysis detailing your home's value as well as a comparison with similar homes in the area
Home Values in the Area
Average Home Value in this Area
Purchase History
| Date | Buyer | Sale Price | Title Company |
|---|---|---|---|
| Bowers Kenneth L | $79,500 | None Available | |
| Finch Amanda | $71,000 | -- |
Source: Public Records
Mortgage History
| Date | Status | Borrower | Loan Amount |
|---|---|---|---|
| Open | Bowers Kenneth L | $77,972 | |
| Previous Owner | Finch Amanda | $70,913 | |
| Closed | Finch Amanda | $12,000 |
Source: Public Records
Tax History Compared to Growth
Tax History
| Year | Tax Paid | Tax Assessment Tax Assessment Total Assessment is a certain percentage of the fair market value that is determined by local assessors to be the total taxable value of land and additions on the property. | Land | Improvement |
|---|---|---|---|---|
| 2025 | $2,640 | $164,800 | $31,800 | $133,000 |
| 2024 | $2,640 | $144,700 | $27,500 | $117,200 |
| 2023 | $2,682 | $144,700 | $27,500 | $117,200 |
| 2022 | $2,660 | $122,700 | $24,000 | $98,700 |
| 2021 | $2,466 | $122,700 | $24,000 | $98,700 |
| 2020 | $2,556 | $107,400 | $20,900 | $86,500 |
| 2019 | $2,310 | $107,400 | $20,900 | $86,500 |
| 2018 | $2,282 | $94,500 | $18,100 | $76,400 |
| 2017 | $2,126 | $94,500 | $18,100 | $76,400 |
| 2016 | $2,066 | $87,100 | $16,300 | $70,800 |
| 2015 | $2,066 | $87,100 | $16,300 | $70,800 |
| 2014 | $2,090 | $91,100 | $16,700 | $74,400 |
Source: Public Records
Map
Nearby Homes