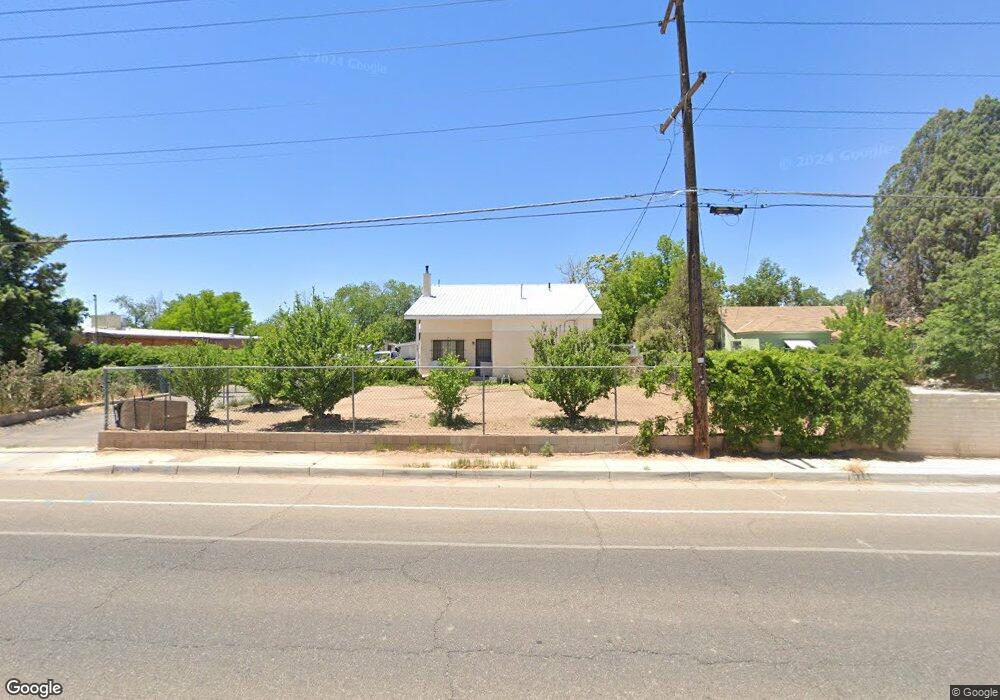
4109 12th St NW Albuquerque, NM 87107
Estimated Value: $227,000 - $343,051
2
Beds
1
Bath
1,980
Sq Ft
$145/Sq Ft
Est. Value
About This Home
This home is located at 4109 12th St NW, Albuquerque, NM 87107 and is currently estimated at $287,513, approximately $145 per square foot. 4109 12th St NW is a home located in Bernalillo County with nearby schools including Griegos Elementary School, Garfield Middle, and Valley High School.
Create a Home Valuation Report for This Property
The Home Valuation Report is an in-depth analysis detailing your home's value as well as a comparison with similar homes in the area
Home Values in the Area
Average Home Value in this Area
Tax History Compared to Growth
Tax History
| Year | Tax Paid | Tax Assessment Tax Assessment Total Assessment is a certain percentage of the fair market value that is determined by local assessors to be the total taxable value of land and additions on the property. | Land | Improvement |
|---|---|---|---|---|
| 2025 | $2,609 | $61,869 | $25,478 | $36,391 |
| 2024 | $2,609 | $60,068 | $24,737 | $35,331 |
| 2023 | $2,553 | $58,319 | $24,016 | $34,303 |
| 2022 | $2,410 | $56,621 | $23,317 | $33,304 |
| 2021 | $2,322 | $54,972 | $22,638 | $32,334 |
| 2020 | $2,272 | $53,371 | $21,979 | $31,392 |
| 2019 | $2,197 | $51,817 | $21,339 | $30,478 |
| 2018 | $2,112 | $51,817 | $21,339 | $30,478 |
| 2017 | $2,029 | $50,308 | $20,718 | $29,590 |
| 2016 | $1,953 | $47,421 | $19,529 | $27,892 |
| 2015 | $46,040 | $46,040 | $18,960 | $27,080 |
| 2014 | $1,805 | $44,699 | $18,408 | $26,291 |
| 2013 | -- | $43,398 | $17,872 | $25,526 |
Source: Public Records
Map
Nearby Homes
- 4208 Trinity Place NW
- 1224 Arvilla Ave NW
- 4011 Broadview Place NW
- 4516 Grande Dr NW
- 828 San Clemente Ave NW
- 1301 Valle Ln NW
- 3720 Candelarias Ln NW
- 614 San Lorenzo Ave NW
- 4616 9th St NW
- 502 Headingly Ave NW
- 834 Griegos Rd NW
- 704 Griegos Rd NW
- 902 Palo Duro Ave NW
- 4842 Guadalupe Trail NW Unit C
- 4913 Guadalupe Trail NW
- 425 Fitzgerald Rd NW
- 4457 3rd St NW
- 304 Mescalero Rd NW
- 229 Mescalero Rd NW
- 5100 Guadalupe Trail NW
- 4207 12th St NW
- 4115 12th St NW
- 4103 12th St NW
- 4203 12th St NW
- 4009 12th St NW
- 4110 12th St NW
- 4110 12th St NW
- 4120 Sunland Cir NW
- 1127 La Luz Dr NW
- 4014 12th St NW
- 4209 12th St NW
- 4124 Sunland Cir NW
- 4116 Sunland Cir NW
- 4100 Grande Dr NW
- 4208 12th St NW
- 1122 La Luz Dr NW
- 4128 Sunland Cir NW
- 1123 La Luz Dr NW
- 4112 Sunland Cir NW
- 4215 12th St NW