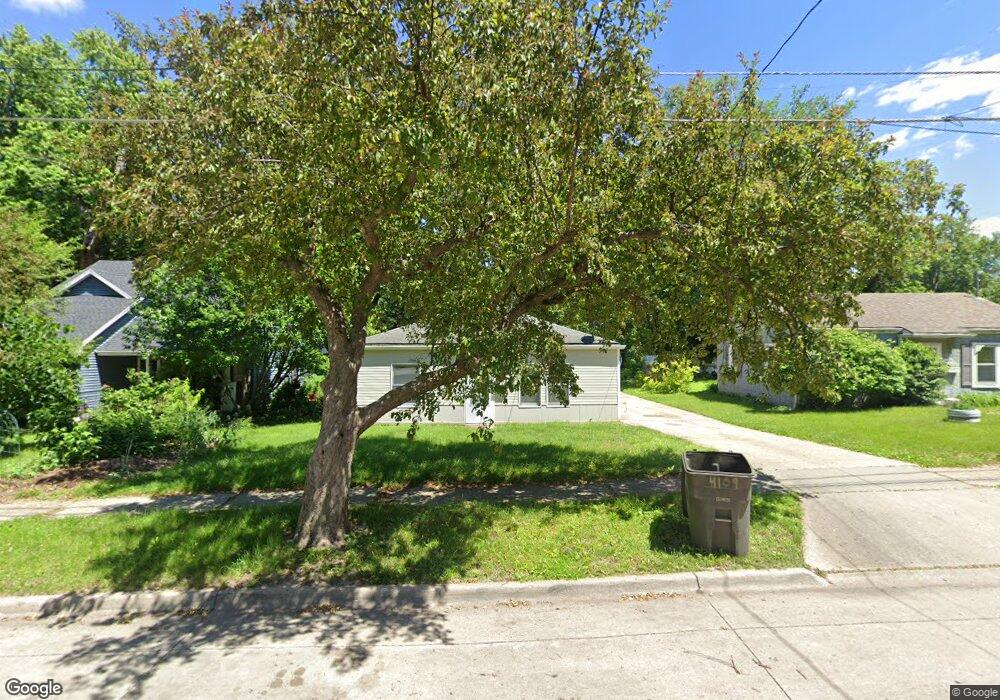
4109 5th Ave Des Moines, IA 50313
Highland Park NeighborhoodEstimated Value: $161,000 - $196,574
2
Beds
1
Bath
1,131
Sq Ft
$156/Sq Ft
Est. Value
About This Home
This home is located at 4109 5th Ave, Des Moines, IA 50313 and is currently estimated at $176,144, approximately $155 per square foot. 4109 5th Ave is a home located in Polk County with nearby schools including Oak Park Elementary School, Harding Middle School, and North High School.
Ownership History
Date
Name
Owned For
Owner Type
Purchase Details
Closed on
Mar 12, 2019
Sold by
Engler Michelle
Bought by
Omni Investments Llc Series 1917
Current Estimated Value
Purchase Details
Closed on
Sep 20, 2006
Sold by
Fv-1 Inc
Bought by
Engler Michelle
Home Financials for this Owner
Home Financials are based on the most recent Mortgage that was taken out on this home.
Original Mortgage
$90,000
Interest Rate
6.36%
Mortgage Type
Purchase Money Mortgage
Purchase Details
Closed on
Feb 3, 2006
Sold by
Cook Tracy and Wright Roxanne
Bought by
Mortgage Electronic Registration Systems
Purchase Details
Closed on
Sep 7, 2004
Sold by
Snyder Keith P
Bought by
Cook Tracy
Home Financials for this Owner
Home Financials are based on the most recent Mortgage that was taken out on this home.
Original Mortgage
$71,113
Interest Rate
8.95%
Mortgage Type
Purchase Money Mortgage
Create a Home Valuation Report for This Property
The Home Valuation Report is an in-depth analysis detailing your home's value as well as a comparison with similar homes in the area
Home Values in the Area
Average Home Value in this Area
Purchase History
| Date | Buyer | Sale Price | Title Company |
|---|---|---|---|
| Omni Investments Llc Series 1917 | -- | None Available | |
| Engler Michelle | $61,500 | Itc | |
| Fv-1 Inc | -- | Title Services Corporation | |
| Mortgage Electronic Registration Systems | $84,025 | None Available | |
| Cook Tracy | $88,500 | -- |
Source: Public Records
Mortgage History
| Date | Status | Borrower | Loan Amount |
|---|---|---|---|
| Previous Owner | Engler Michelle | $90,000 | |
| Previous Owner | Cook Tracy | $71,113 |
Source: Public Records
Tax History Compared to Growth
Tax History
| Year | Tax Paid | Tax Assessment Tax Assessment Total Assessment is a certain percentage of the fair market value that is determined by local assessors to be the total taxable value of land and additions on the property. | Land | Improvement |
|---|---|---|---|---|
| 2025 | $2,584 | $150,000 | $31,300 | $118,700 |
| 2024 | $2,584 | $131,400 | $27,100 | $104,300 |
| 2023 | $2,670 | $131,400 | $27,100 | $104,300 |
| 2022 | $2,650 | $113,300 | $23,600 | $89,700 |
| 2021 | $2,468 | $113,300 | $23,600 | $89,700 |
| 2020 | $2,564 | $98,900 | $20,600 | $78,300 |
| 2019 | $2,364 | $98,900 | $20,600 | $78,300 |
| 2018 | $2,342 | $88,000 | $17,800 | $70,200 |
| 2017 | $2,239 | $88,000 | $17,800 | $70,200 |
| 2016 | $2,118 | $80,400 | $16,100 | $64,300 |
| 2015 | $2,118 | $80,400 | $16,100 | $64,300 |
| 2014 | $2,070 | $80,800 | $15,700 | $65,100 |
Source: Public Records
Map
Nearby Homes