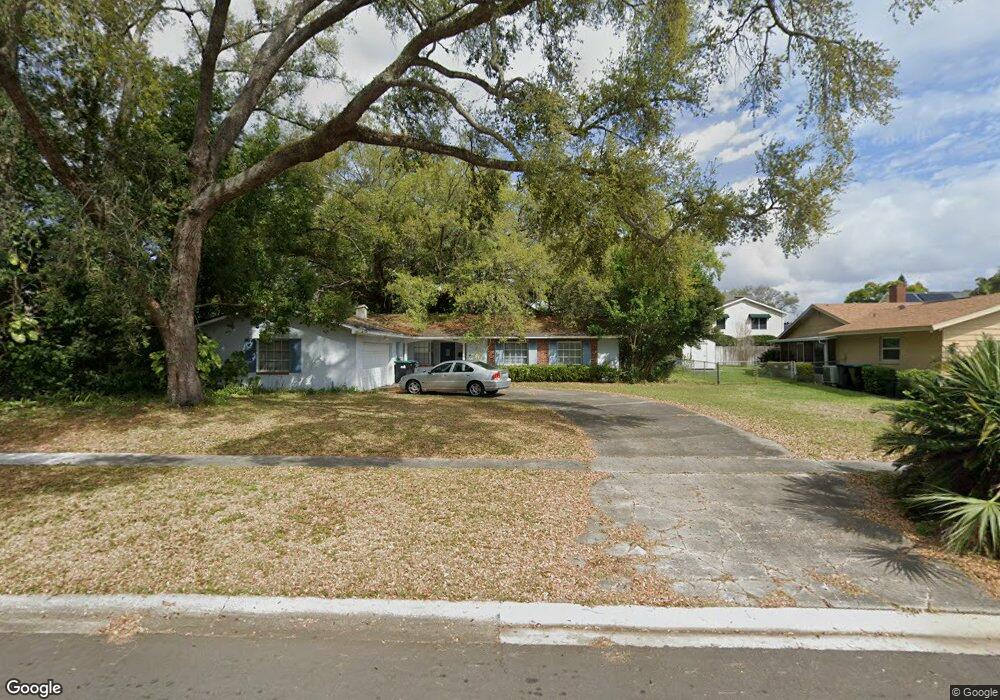
4109 Luray Dr Orlando, FL 32812
Conway NeighborhoodEstimated Value: $312,000 - $469,000
4
Beds
2
Baths
1,661
Sq Ft
$235/Sq Ft
Est. Value
About This Home
This home is located at 4109 Luray Dr, Orlando, FL 32812 and is currently estimated at $390,335, approximately $235 per square foot. 4109 Luray Dr is a home located in Orange County with nearby schools including Shenandoah Elementary School, Conway Middle School, and Boone High School.
Ownership History
Date
Name
Owned For
Owner Type
Purchase Details
Closed on
Aug 16, 2023
Sold by
Wahlig Christopher J
Bought by
Gregory John W
Current Estimated Value
Home Financials for this Owner
Home Financials are based on the most recent Mortgage that was taken out on this home.
Original Mortgage
$150,000
Outstanding Balance
$146,582
Interest Rate
6.81%
Mortgage Type
New Conventional
Estimated Equity
$243,753
Purchase Details
Closed on
Jun 2, 1999
Sold by
Tanke Mary M and Tanke Paul D
Bought by
Wahlig Christophe J
Home Financials for this Owner
Home Financials are based on the most recent Mortgage that was taken out on this home.
Original Mortgage
$122,000
Interest Rate
6.9%
Mortgage Type
New Conventional
Purchase Details
Closed on
Oct 2, 1997
Sold by
O'Donnell Mark W and O'Donnell Denise
Bought by
Tanke Mary M and Tanke Paul D
Home Financials for this Owner
Home Financials are based on the most recent Mortgage that was taken out on this home.
Original Mortgage
$75,000
Interest Rate
7.46%
Mortgage Type
New Conventional
Create a Home Valuation Report for This Property
The Home Valuation Report is an in-depth analysis detailing your home's value as well as a comparison with similar homes in the area
Home Values in the Area
Average Home Value in this Area
Purchase History
| Date | Buyer | Sale Price | Title Company |
|---|---|---|---|
| Gregory John W | $290,000 | First American Title Insurance | |
| Wahlig Christophe J | $130,000 | -- | |
| Tanke Mary M | $125,000 | -- |
Source: Public Records
Mortgage History
| Date | Status | Borrower | Loan Amount |
|---|---|---|---|
| Open | Gregory John W | $150,000 | |
| Previous Owner | Tanke Mary M | $122,000 | |
| Previous Owner | Tanke Mary M | $75,000 |
Source: Public Records
Tax History Compared to Growth
Tax History
| Year | Tax Paid | Tax Assessment Tax Assessment Total Assessment is a certain percentage of the fair market value that is determined by local assessors to be the total taxable value of land and additions on the property. | Land | Improvement |
|---|---|---|---|---|
| 2025 | $4,906 | $283,820 | $120,000 | $163,820 |
| 2024 | $2,254 | $276,130 | $120,000 | $156,130 |
| 2023 | $2,254 | $162,508 | $0 | $0 |
| 2022 | $2,138 | $157,775 | $0 | $0 |
| 2021 | $2,092 | $153,180 | $0 | $0 |
| 2020 | $1,986 | $151,065 | $0 | $0 |
| 2019 | $2,031 | $147,669 | $0 | $0 |
| 2018 | $2,009 | $144,916 | $0 | $0 |
| 2017 | $1,971 | $210,671 | $78,000 | $132,671 |
| 2016 | $1,941 | $197,218 | $65,000 | $132,218 |
| 2015 | $1,972 | $158,920 | $60,000 | $98,920 |
| 2014 | $2,017 | $159,842 | $80,000 | $79,842 |
Source: Public Records
Map
Nearby Homes
- 4119 Pecan Ln
- 3605 Pershing Ave
- 4015 Carolwood St
- 4478 Yachtmans Ct
- 4436 Yachtmans Ct
- 4358 Tidewater Dr
- 4045 Lake Conway Woods Blvd
- 3417 Pershing Ave
- 4420 Conway Gardens Rd
- 4427 Gilpin Way
- 4141 Fallwood Cir
- 4422 Meadowood St
- 4126 Montrose Ct
- 4020 Montrose Ct
- 3379 Monika Cir
- 4210 Waterfront Pkwy
- 4202 Mizell St
- 4047 Lillian Hall Ln
- 4822 S Conway Rd Unit 125
- 4890 Conway Rd Unit 66
- 4115 Luray Dr
- 4103 Luray Dr
- 4139 Conway Place Cir
- 4145 Conway Place Cir
- 4133 Conway Place Cir
- 4031 Luray Dr
- 4123 Old Dominion Rd
- 4102 Luray Dr
- 4108 Luray Dr
- 4151 Conway Place Cir
- 4127 Conway Place Cir
- 4146 Conway Place Cir
- 4025 Luray Dr
- 4140 Conway Place Cir
- 4129 Old Dominion Rd
- 4024 Luray Dr
- 4152 Conway Place Cir
- 4119 Old Dominion Rd
- 4134 Conway Place Cir
- 4157 Conway Place Cir