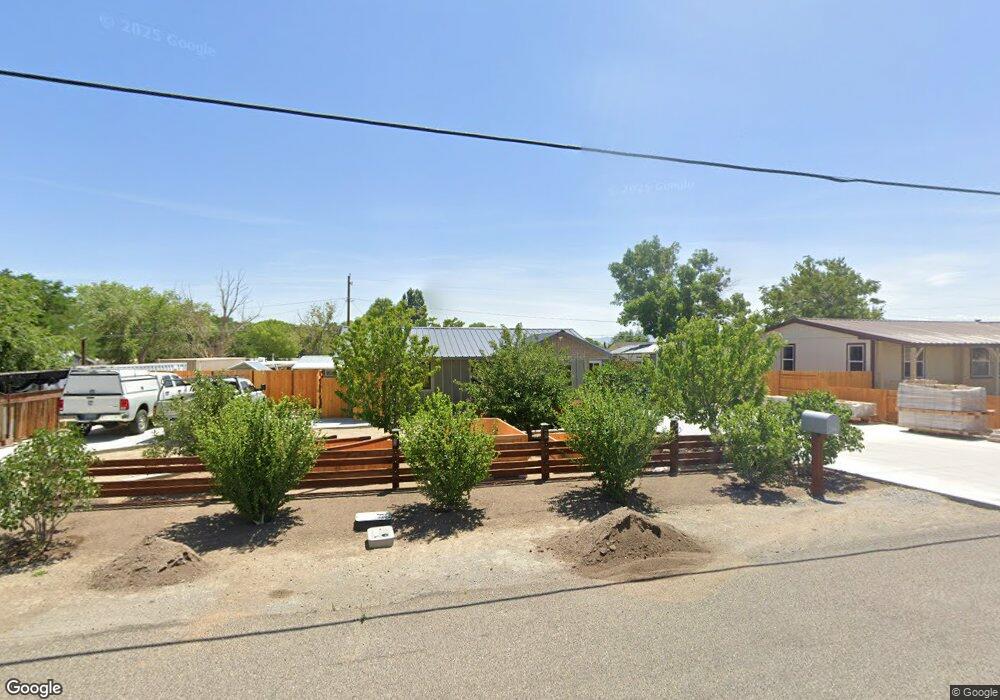
411 1st Ave Yerington, NV 89447
Estimated Value: $220,000 - $267,829
2
Beds
1
Bath
936
Sq Ft
$264/Sq Ft
Est. Value
About This Home
This home is located at 411 1st Ave, Yerington, NV 89447 and is currently estimated at $246,943, approximately $263 per square foot. 411 1st Ave is a home located in Lyon County with nearby schools including Yerington Elementary School, Yerington Intermediate School, and Yerington High School.
Ownership History
Date
Name
Owned For
Owner Type
Purchase Details
Closed on
Feb 15, 2011
Sold by
Deutsche Bank National Trust Company
Bought by
Wells Donald A and Wells Debbie L
Current Estimated Value
Home Financials for this Owner
Home Financials are based on the most recent Mortgage that was taken out on this home.
Original Mortgage
$30,700
Outstanding Balance
$21,216
Interest Rate
4.99%
Mortgage Type
FHA
Estimated Equity
$225,727
Purchase Details
Closed on
Jul 21, 2010
Sold by
Vandiver John and Van Diver Valerie
Bought by
Deutsche Bank National Trust Company
Purchase Details
Closed on
Mar 14, 2006
Sold by
Tate Ruth
Bought by
Vandiver John and Van Diver Valerie
Home Financials for this Owner
Home Financials are based on the most recent Mortgage that was taken out on this home.
Original Mortgage
$124,450
Interest Rate
10.25%
Mortgage Type
Purchase Money Mortgage
Create a Home Valuation Report for This Property
The Home Valuation Report is an in-depth analysis detailing your home's value as well as a comparison with similar homes in the area
Home Values in the Area
Average Home Value in this Area
Purchase History
| Date | Buyer | Sale Price | Title Company |
|---|---|---|---|
| Wells Donald A | $31,500 | Ticor Title Of Nevada Inc | |
| Deutsche Bank National Trust Company | $67,813 | Stewart Title | |
| Vandiver John | $131,000 | Western Title Company Inc |
Source: Public Records
Mortgage History
| Date | Status | Borrower | Loan Amount |
|---|---|---|---|
| Open | Wells Donald A | $30,700 | |
| Previous Owner | Vandiver John | $124,450 |
Source: Public Records
Tax History Compared to Growth
Tax History
| Year | Tax Paid | Tax Assessment Tax Assessment Total Assessment is a certain percentage of the fair market value that is determined by local assessors to be the total taxable value of land and additions on the property. | Land | Improvement |
|---|---|---|---|---|
| 2025 | $1,343 | $58,748 | $21,175 | $37,573 |
| 2024 | $1,305 | $59,832 | $21,175 | $38,657 |
| 2023 | $1,305 | $56,884 | $21,175 | $35,709 |
| 2022 | $1,227 | $49,050 | $16,275 | $32,775 |
| 2021 | $1,046 | $38,445 | $10,185 | $28,260 |
| 2020 | $1,016 | $37,593 | $10,190 | $27,403 |
| 2019 | $884 | $34,189 | $10,190 | $23,999 |
| 2018 | $671 | $21,970 | $3,400 | $18,570 |
| 2017 | $652 | $22,295 | $3,400 | $18,895 |
| 2016 | $635 | $18,858 | $3,400 | $15,458 |
| 2015 | $634 | $13,078 | $3,400 | $9,678 |
| 2014 | $473 | $17,227 | $3,400 | $13,827 |
Source: Public Records
Map
Nearby Homes