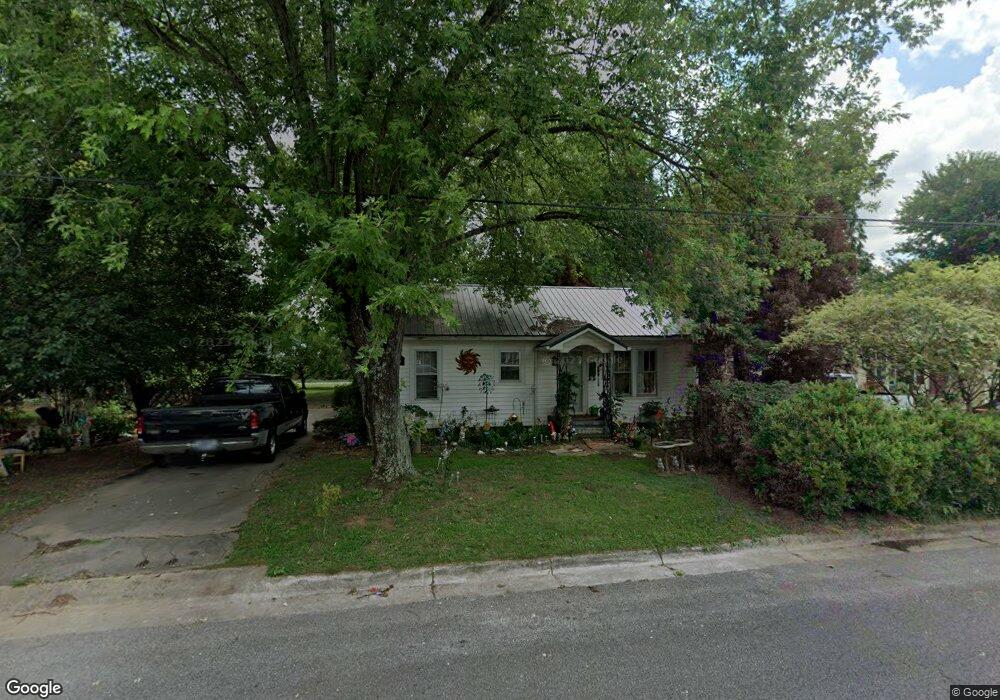
411 6th St Lawrenceburg, TN 38464
Estimated Value: $90,000 - $166,000
--
Bed
1
Bath
924
Sq Ft
$129/Sq Ft
Est. Value
About This Home
This home is located at 411 6th St, Lawrenceburg, TN 38464 and is currently estimated at $118,941, approximately $128 per square foot. 411 6th St is a home located in Lawrence County with nearby schools including Ingram Sowell Elementary School, Lawrenceburg Public Elementary School, and David Crockett Elementary School.
Ownership History
Date
Name
Owned For
Owner Type
Purchase Details
Closed on
Dec 8, 2005
Sold by
Elliott Bailey Ronald
Bought by
Catherine Story
Current Estimated Value
Home Financials for this Owner
Home Financials are based on the most recent Mortgage that was taken out on this home.
Original Mortgage
$50,350
Outstanding Balance
$36,234
Interest Rate
10.7%
Estimated Equity
$82,707
Purchase Details
Closed on
Nov 7, 1989
Bought by
Bailey Ronald E
Purchase Details
Closed on
Jul 7, 1947
Bought by
Bailey Lawrence and Bailey Lois
Create a Home Valuation Report for This Property
The Home Valuation Report is an in-depth analysis detailing your home's value as well as a comparison with similar homes in the area
Home Values in the Area
Average Home Value in this Area
Purchase History
| Date | Buyer | Sale Price | Title Company |
|---|---|---|---|
| Catherine Story | $53,000 | -- | |
| Bailey Ronald E | -- | -- | |
| Bailey Lawrence | -- | -- |
Source: Public Records
Mortgage History
| Date | Status | Borrower | Loan Amount |
|---|---|---|---|
| Open | Bailey Lawrence | $50,350 |
Source: Public Records
Tax History Compared to Growth
Tax History
| Year | Tax Paid | Tax Assessment Tax Assessment Total Assessment is a certain percentage of the fair market value that is determined by local assessors to be the total taxable value of land and additions on the property. | Land | Improvement |
|---|---|---|---|---|
| 2025 | $456 | $14,675 | $0 | $0 |
| 2024 | $456 | $14,675 | $2,000 | $12,675 |
| 2023 | $456 | $14,675 | $2,000 | $12,675 |
| 2022 | $456 | $14,675 | $2,000 | $12,675 |
| 2021 | $453 | $10,300 | $2,000 | $8,300 |
| 2020 | $453 | $10,300 | $2,000 | $8,300 |
| 2019 | $453 | $10,300 | $2,000 | $8,300 |
| 2018 | $453 | $10,300 | $2,000 | $8,300 |
| 2017 | $453 | $10,300 | $2,000 | $8,300 |
| 2016 | $453 | $10,300 | $2,000 | $8,300 |
| 2015 | $429 | $10,300 | $2,000 | $8,300 |
| 2014 | $441 | $10,600 | $2,000 | $8,600 |
Source: Public Records
Map
Nearby Homes