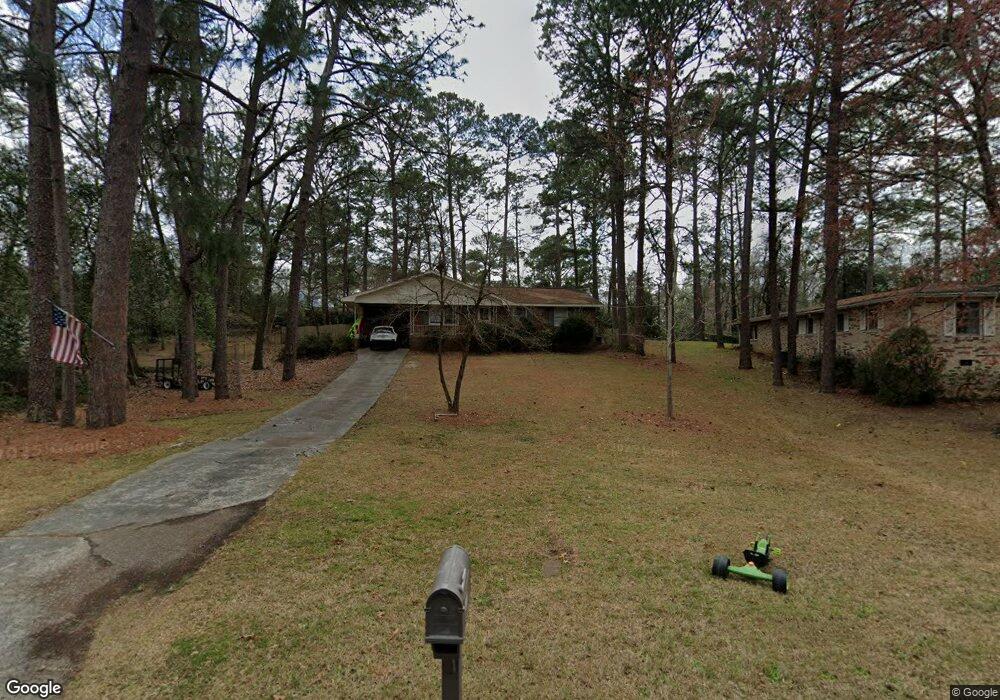
411 Ashby Way Warner Robins, GA 31088
Estimated Value: $149,280 - $181,000
Studio
2
Baths
1,423
Sq Ft
$116/Sq Ft
Est. Value
About This Home
This home is located at 411 Ashby Way, Warner Robins, GA 31088 and is currently estimated at $165,320, approximately $116 per square foot. 411 Ashby Way is a home located in Houston County with nearby schools including Shirley Hills Elementary School, Warner Robins Middle School, and Warner Robins High School.
Ownership History
Date
Name
Owned For
Owner Type
Purchase Details
Closed on
Jul 21, 2016
Sold by
Ricky D
Bought by
Gunningham Brian A and Gunningham Terri L
Current Estimated Value
Home Financials for this Owner
Home Financials are based on the most recent Mortgage that was taken out on this home.
Original Mortgage
$50,000
Interest Rate
3.56%
Mortgage Type
New Conventional
Purchase Details
Closed on
Jul 6, 2016
Sold by
Michael A
Bought by
Rolan Ricky D
Home Financials for this Owner
Home Financials are based on the most recent Mortgage that was taken out on this home.
Original Mortgage
$50,000
Interest Rate
3.56%
Mortgage Type
New Conventional
Purchase Details
Closed on
Mar 21, 2013
Sold by
Tuggle Robert T
Bought by
Schell Michael A and Rolan Ricky D
Purchase Details
Closed on
Nov 27, 1991
Sold by
Jones Thomas J and Jones Sara S
Bought by
Jones Thomas J and Sara S*
Purchase Details
Closed on
Apr 17, 1964
Bought by
Jones Thomas J and Jones Wife
Create a Home Valuation Report for This Property
The Home Valuation Report is an in-depth analysis detailing your home's value as well as a comparison with similar homes in the area
Home Values in the Area
Average Home Value in this Area
Purchase History
| Date | Buyer | Sale Price | Title Company |
|---|---|---|---|
| Gunningham Brian A | $62,500 | -- | |
| Rolan Ricky D | -- | -- | |
| Schell Michael A | -- | None Available | |
| Jones Thomas J | -- | -- | |
| Jones Thomas J | -- | -- |
Source: Public Records
Mortgage History
| Date | Status | Borrower | Loan Amount |
|---|---|---|---|
| Closed | Gunningham Brian A | $50,000 | |
| Closed | Schell Michael A | $0 |
Source: Public Records
Tax History
| Year | Tax Paid | Tax Assessment Tax Assessment Total Assessment is a certain percentage of the fair market value that is determined by local assessors to be the total taxable value of land and additions on the property. | Land | Improvement |
|---|---|---|---|---|
| 2024 | $1,677 | $51,240 | $6,000 | $45,240 |
| 2023 | $1,389 | $42,120 | $6,000 | $36,120 |
| 2022 | $879 | $38,240 | $6,000 | $32,240 |
| 2021 | $785 | $33,960 | $6,000 | $27,960 |
| 2020 | $648 | $27,880 | $4,800 | $23,080 |
| 2019 | $648 | $27,880 | $4,800 | $23,080 |
| 2018 | $648 | $27,880 | $4,800 | $23,080 |
| 2017 | $581 | $27,880 | $4,800 | $23,080 |
| 2016 | $649 | $27,880 | $4,800 | $23,080 |
| 2015 | -- | $27,880 | $4,800 | $23,080 |
| 2014 | -- | $28,880 | $4,800 | $24,080 |
| 2013 | -- | $28,880 | $4,800 | $24,080 |
Source: Public Records
Map
Nearby Homes
- 413 Ashby Way
- 604 Arrowhead Trail
- 606 Arrowhead Trail
- 407 Ashby Way
- 602 Arrowhead Trail
- 118 Colonial Rd
- 410 Ashby Way
- 202 Chestnut Rd
- 608 Arrowhead Trail
- 200 Chestnut Rd
- 300 Chestnut Rd
- 116 Colonial Rd
- 405 Ashby Way
- 406 Ashby Way
- 302 Chestnut Rd
- 607 Arrowhead Trail
- 605 Arrowhead Trail
- 609 Arrowhead Trail
- 203 Chestnut Rd
- 106 Arrowhead Trail
Your Personal Tour Guide
Ask me questions while you tour the home.