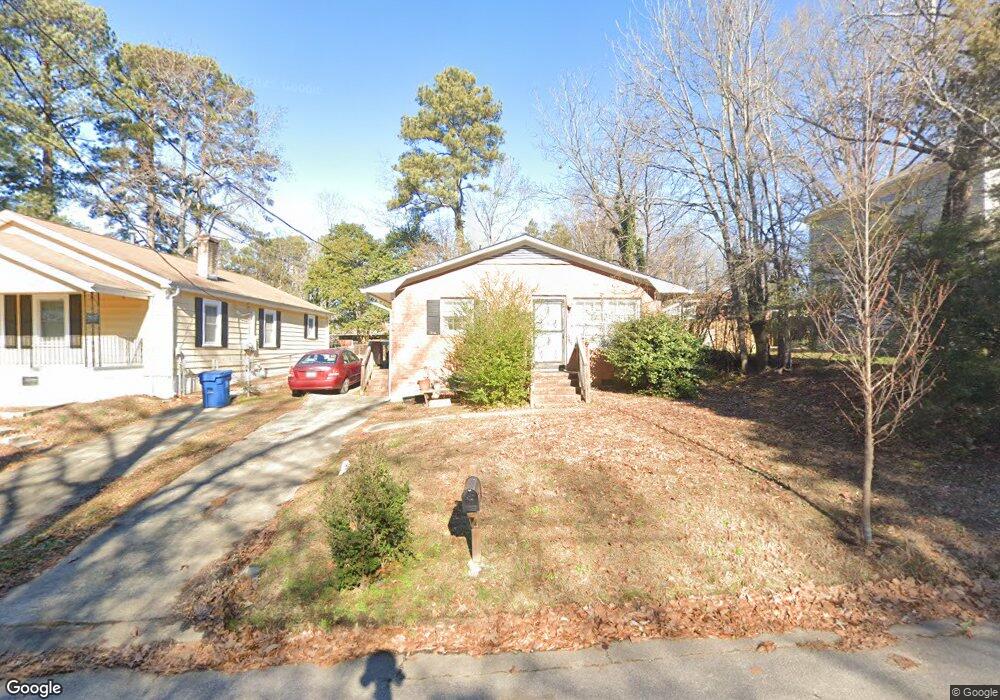
411 Dupree St Durham, NC 27707
Spaulding Community NeighborhoodEstimated Value: $256,247 - $309,000
2
Beds
2
Baths
1,014
Sq Ft
$274/Sq Ft
Est. Value
About This Home
This home is located at 411 Dupree St, Durham, NC 27707 and is currently estimated at $277,562, approximately $273 per square foot. 411 Dupree St is a home located in Durham County with nearby schools including C. C. Spaulding Elementary, Morehead Montessori, and Graceville Colony - 07.
Ownership History
Date
Name
Owned For
Owner Type
Purchase Details
Closed on
Sep 26, 2002
Sold by
Mcintosh Vick Oveta Birden and Vick Mcdonald
Bought by
Young Jimmie L
Current Estimated Value
Home Financials for this Owner
Home Financials are based on the most recent Mortgage that was taken out on this home.
Original Mortgage
$82,000
Outstanding Balance
$34,503
Interest Rate
6.21%
Mortgage Type
Purchase Money Mortgage
Estimated Equity
$243,059
Purchase Details
Closed on
Mar 7, 2001
Sold by
Satterfield Willie Mae and Purvis Willie S
Bought by
Mcintosh Vick Oveta Birdena
Create a Home Valuation Report for This Property
The Home Valuation Report is an in-depth analysis detailing your home's value as well as a comparison with similar homes in the area
Home Values in the Area
Average Home Value in this Area
Purchase History
| Date | Buyer | Sale Price | Title Company |
|---|---|---|---|
| Young Jimmie L | $70,000 | -- | |
| Mcintosh Vick Oveta Birdena | -- | -- |
Source: Public Records
Mortgage History
| Date | Status | Borrower | Loan Amount |
|---|---|---|---|
| Open | Young Jimmie L | $82,000 |
Source: Public Records
Tax History Compared to Growth
Tax History
| Year | Tax Paid | Tax Assessment Tax Assessment Total Assessment is a certain percentage of the fair market value that is determined by local assessors to be the total taxable value of land and additions on the property. | Land | Improvement |
|---|---|---|---|---|
| 2025 | $2,783 | $280,760 | $141,250 | $139,510 |
| 2024 | $1,413 | $101,318 | $56,250 | $45,068 |
| 2023 | $1,327 | $101,318 | $56,250 | $45,068 |
| 2022 | $1,297 | $101,318 | $56,250 | $45,068 |
| 2021 | $1,291 | $101,318 | $56,250 | $45,068 |
| 2020 | $1,260 | $101,318 | $56,250 | $45,068 |
| 2019 | $1,260 | $101,318 | $56,250 | $45,068 |
| 2018 | $963 | $70,971 | $14,062 | $56,909 |
| 2017 | $956 | $70,971 | $14,062 | $56,909 |
| 2016 | $923 | $70,971 | $14,062 | $56,909 |
| 2015 | $963 | $69,582 | $17,883 | $51,699 |
| 2014 | $963 | $69,582 | $17,883 | $51,699 |
Source: Public Records
Map
Nearby Homes
- 411 Dunstan Ave
- 1608 Fayetteville St
- 425 Price Ave
- 1403 S Roxboro St
- 1415 Concord St
- 605 Dupree St
- 602 Dunbar St
- 1314 S Roxboro St
- 107 Bond St
- 1203 Avery St
- 618 Price Ave
- 311 Burnette St
- 1213 Dawkins St
- 1408 South St
- 627 Price Ave
- 300 Price Ave
- 313 E Umstead St
- 315 E Umstead St
- 106 W Umstead St
- 429 Carolina Cir