411 E 7th St Waverly, OH 45690
Estimated Value: $221,000 - $237,000
4
Beds
1
Bath
2,220
Sq Ft
$103/Sq Ft
Est. Value
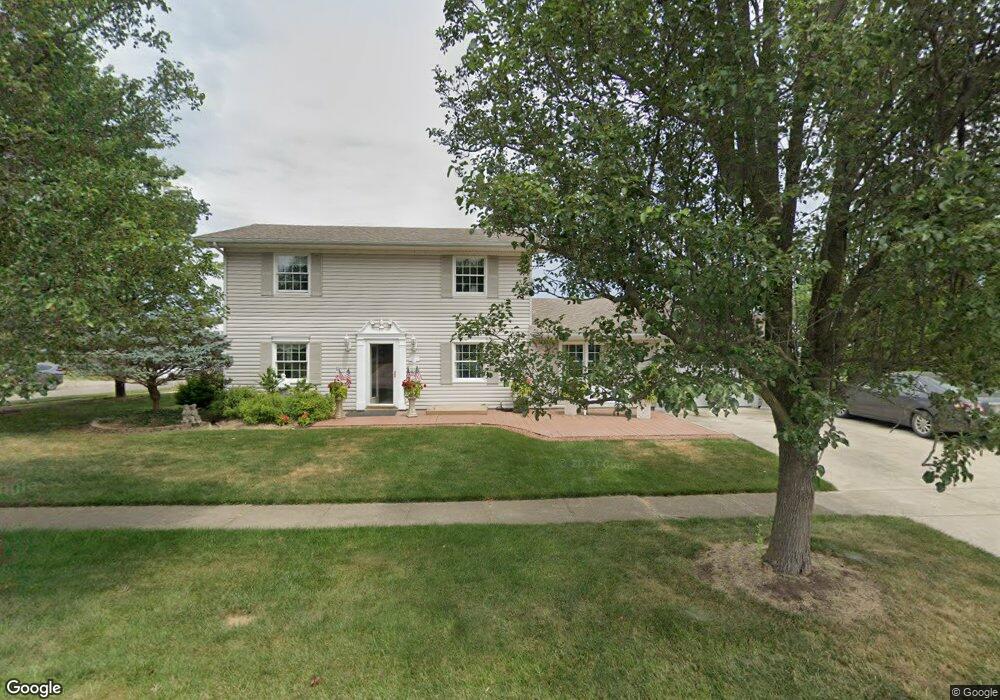
About This Home
This home is located at 411 E 7th St, Waverly, OH 45690 and is currently estimated at $229,653, approximately $103 per square foot. 411 E 7th St is a home located in Pike County with nearby schools including Waverly Primary School, Waverly Intermediate School, and Waverly Junior High School.
Ownership History
Date
Name
Owned For
Owner Type
Purchase Details
Closed on
Oct 25, 2019
Sold by
Parks Kimberly A
Bought by
Case Karla
Current Estimated Value
Home Financials for this Owner
Home Financials are based on the most recent Mortgage that was taken out on this home.
Original Mortgage
$143,150
Outstanding Balance
$126,060
Interest Rate
3.65%
Mortgage Type
New Conventional
Estimated Equity
$103,593
Purchase Details
Closed on
Jun 26, 2017
Sold by
Case Karla R
Bought by
Parks Kimberly A
Home Financials for this Owner
Home Financials are based on the most recent Mortgage that was taken out on this home.
Original Mortgage
$115,000
Interest Rate
4.02%
Mortgage Type
Future Advance Clause Open End Mortgage
Purchase Details
Closed on
Dec 29, 2014
Sold by
Case Kristi S
Bought by
Case Karla R
Purchase Details
Closed on
Oct 7, 2014
Sold by
Parks Kimberly A
Bought by
Case Kristi
Purchase Details
Closed on
Sep 29, 2014
Sold by
Case Kelly R and Reece David R
Bought by
Case Karla R
Purchase Details
Closed on
Feb 8, 2012
Sold by
Case Kendall H and Case Lori A
Bought by
Case Kevin R and Case Ruth B
Create a Home Valuation Report for This Property
The Home Valuation Report is an in-depth analysis detailing your home's value as well as a comparison with similar homes in the area
Home Values in the Area
Average Home Value in this Area
Purchase History
| Date | Buyer | Sale Price | Title Company |
|---|---|---|---|
| Case Karla | $155,000 | Amrock Inc | |
| Parks Kimberly A | $115,000 | None Available | |
| Case Karla R | -- | None Available | |
| Case Kristi | -- | None Available | |
| Case Karla R | -- | None Available | |
| Case Kevin R | $20,000 | None Available |
Source: Public Records
Mortgage History
| Date | Status | Borrower | Loan Amount |
|---|---|---|---|
| Open | Case Karla | $143,150 | |
| Previous Owner | Parks Kimberly A | $115,000 |
Source: Public Records
Tax History Compared to Growth
Tax History
| Year | Tax Paid | Tax Assessment Tax Assessment Total Assessment is a certain percentage of the fair market value that is determined by local assessors to be the total taxable value of land and additions on the property. | Land | Improvement |
|---|---|---|---|---|
| 2024 | $2,236 | $63,170 | $10,510 | $52,660 |
| 2023 | $2,236 | $63,170 | $10,510 | $52,660 |
| 2022 | $1,809 | $44,450 | $6,620 | $37,830 |
| 2021 | $1,775 | $44,450 | $6,620 | $37,830 |
| 2020 | $1,776 | $44,450 | $6,620 | $37,830 |
| 2019 | $1,515 | $37,590 | $5,610 | $31,980 |
| 2018 | $1,611 | $37,590 | $5,610 | $31,980 |
| 2017 | $1,598 | $37,590 | $5,610 | $31,980 |
| 2016 | $1,702 | $41,270 | $5,780 | $35,490 |
| 2015 | $1,703 | $41,270 | $5,780 | $35,490 |
| 2014 | $1,648 | $41,270 | $5,780 | $35,490 |
| 2013 | $1,669 | $41,270 | $5,780 | $35,490 |
| 2012 | $1,347 | $41,270 | $5,780 | $35,490 |
Source: Public Records
Map
Nearby Homes