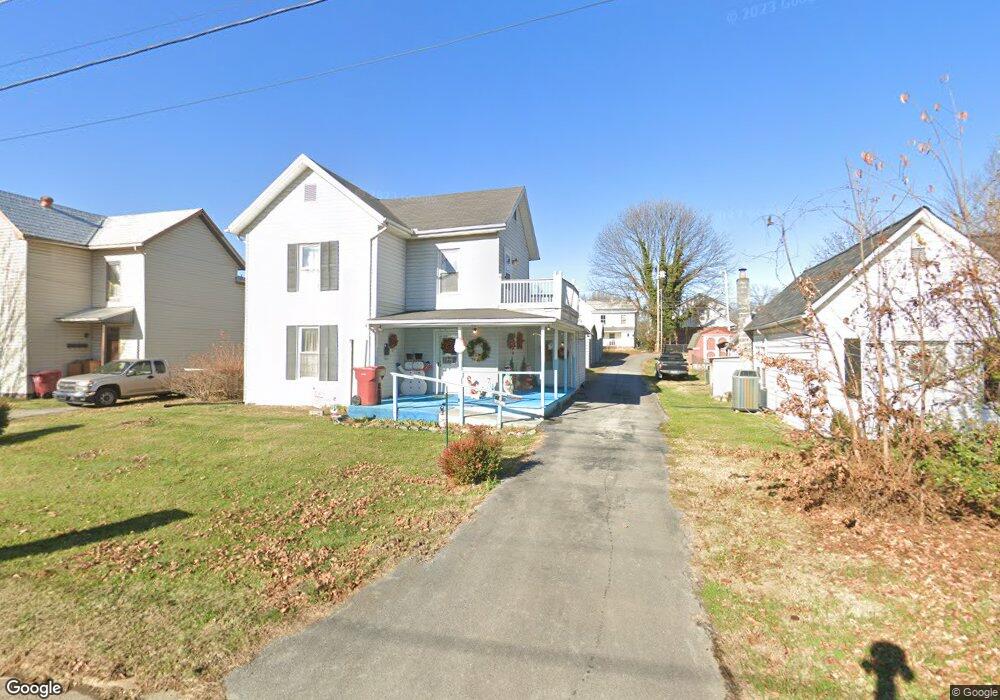
411 E Fairview Ave Johnson City, TN 37601
Gump Addition-Carnegie NeighborhoodEstimated Value: $199,000 - $329,000
4
Beds
2
Baths
1,970
Sq Ft
$132/Sq Ft
Est. Value
About This Home
This home is located at 411 E Fairview Ave, Johnson City, TN 37601 and is currently estimated at $260,570, approximately $132 per square foot. 411 E Fairview Ave is a home located in Washington County with nearby schools including North Side Elementary School, Liberty Bell Middle School, and Science Hill High School.
Ownership History
Date
Name
Owned For
Owner Type
Purchase Details
Closed on
Nov 4, 2003
Sold by
Vaughn Tony R and Vaughn Susie D
Bought by
Buchanan Rickey
Current Estimated Value
Home Financials for this Owner
Home Financials are based on the most recent Mortgage that was taken out on this home.
Original Mortgage
$45,000
Outstanding Balance
$20,004
Interest Rate
5.75%
Estimated Equity
$240,566
Purchase Details
Closed on
Oct 8, 2003
Sold by
Wachovia Bank Of Delaware
Bought by
Vaughn Tony R
Home Financials for this Owner
Home Financials are based on the most recent Mortgage that was taken out on this home.
Original Mortgage
$45,000
Outstanding Balance
$20,004
Interest Rate
5.75%
Estimated Equity
$240,566
Purchase Details
Closed on
Dec 23, 2002
Sold by
Priority Trustee Services
Bought by
Wachovia Bank
Purchase Details
Closed on
Nov 5, 1992
Bought by
Rosenbaum John H
Purchase Details
Closed on
Oct 19, 1992
Bought by
Crowe Cecil G
Purchase Details
Closed on
May 20, 1991
Bought by
Brown Charles Farrell
Create a Home Valuation Report for This Property
The Home Valuation Report is an in-depth analysis detailing your home's value as well as a comparison with similar homes in the area
Home Values in the Area
Average Home Value in this Area
Purchase History
| Date | Buyer | Sale Price | Title Company |
|---|---|---|---|
| Buchanan Rickey | $45,000 | -- | |
| Vaughn Tony R | $35,000 | -- | |
| Wachovia Bank | $68,300 | -- | |
| Rosenbaum John H | $28,500 | -- | |
| Crowe Cecil G | $16,200 | -- | |
| Brown Charles Farrell | $12,500 | -- |
Source: Public Records
Mortgage History
| Date | Status | Borrower | Loan Amount |
|---|---|---|---|
| Open | Brown Charles Farrell | $45,000 | |
| Closed | Brown Charles Farrell | $31,500 |
Source: Public Records
Tax History
| Year | Tax Paid | Tax Assessment Tax Assessment Total Assessment is a certain percentage of the fair market value that is determined by local assessors to be the total taxable value of land and additions on the property. | Land | Improvement |
|---|---|---|---|---|
| 2025 | $1,165 | $68,150 | $4,700 | $63,450 |
| 2024 | $1,165 | $68,150 | $4,700 | $63,450 |
| 2022 | $673 | $31,325 | $3,750 | $27,575 |
| 2021 | $1,215 | $31,325 | $3,750 | $27,575 |
| 2020 | $1,209 | $31,325 | $3,750 | $27,575 |
| 2019 | $610 | $31,325 | $3,750 | $27,575 |
| 2018 | $1,095 | $25,650 | $2,500 | $23,150 |
| 2017 | $1,095 | $25,650 | $2,500 | $23,150 |
| 2016 | $1,090 | $25,650 | $2,500 | $23,150 |
| 2015 | $987 | $25,650 | $2,500 | $23,150 |
| 2014 | $923 | $25,650 | $2,500 | $23,150 |
Source: Public Records
Map
Nearby Homes
- 106 Water St
- 201 E Unaka Ave
- 116 E Unaka Ave
- 824 E Myrtle Ave
- 219 E Chilhowie Ave
- Tbd E Ave
- 305 Montgomery St
- 906 N Boone St
- 7 Llewellyn Wood Rd
- 1206 E Myrtle Ave
- 900 Grover St
- 102 W Maple St
- 1008 N Boone St
- 304 W Chilhowie Ave
- 319 W Chilhowie Ave
- 5 Llewellyn Wood
- 1007 Spring St
- 1101 Afton St
- 410 W 8th Ave
- 630 E Maple St
- 413 E Fairview Ave
- 409 E Fairview Ave
- 415 E Fairview Ave
- 407 E Fairview Ave
- 405 E Fairview Ave
- 410 E Myrtle Ave
- 406 E Myrtle Ave
- 414 E Fairview Ave
- 414 E Myrtle Ave
- 403 E Fairview Ave
- 410 E Fairview Ave
- 501 E Fairview Ave
- 412 E Fairview Ave
- 404 E Myrtle Ave
- 404 E Fairview Ave
- 401 E Fairview Ave
- 503 E Fairview Ave
- 402 E Myrtle Ave
- 500 E Myrtle Ave
- 402 E Fairview Ave
Your Personal Tour Guide
Ask me questions while you tour the home.