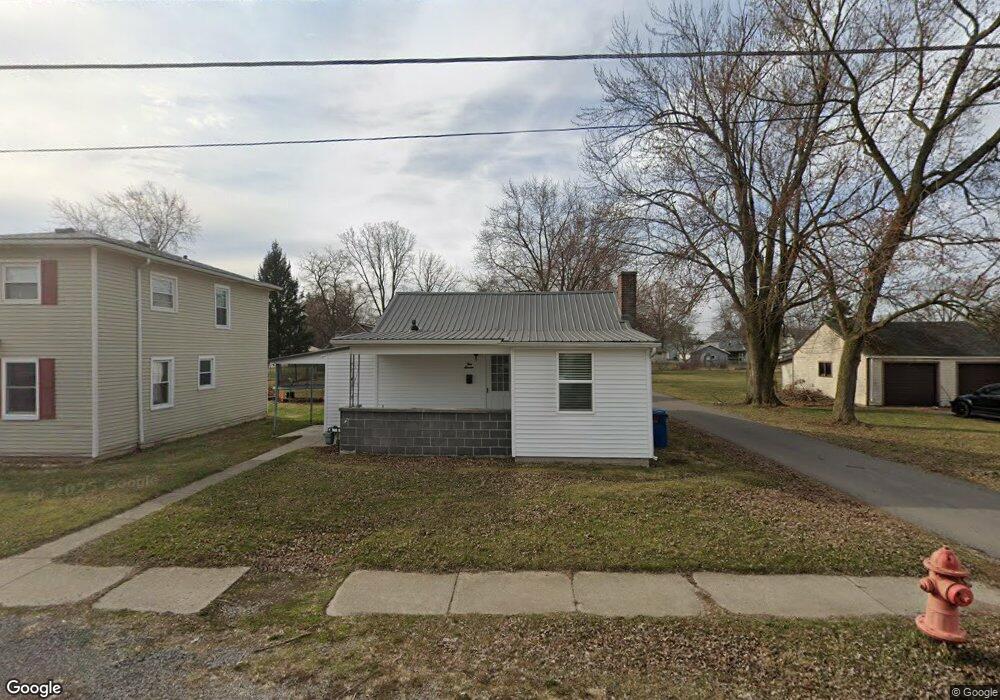
411 E Foulke Ave Findlay, OH 45840
Estimated Value: $111,000 - $158,000
1
Bed
1
Bath
862
Sq Ft
$154/Sq Ft
Est. Value
About This Home
This home is located at 411 E Foulke Ave, Findlay, OH 45840 and is currently estimated at $132,334, approximately $153 per square foot. 411 E Foulke Ave is a home located in Hancock County with nearby schools including Whittier Primary School, Bigelow Hill Elementary School, and Glenwood Middle School.
Ownership History
Date
Name
Owned For
Owner Type
Purchase Details
Closed on
May 14, 2010
Sold by
Oler Robert A and Oler Jane E
Bought by
Oler Investment Properties Ltd
Current Estimated Value
Purchase Details
Closed on
Jun 7, 1994
Sold by
Hughes Katrina
Bought by
Oler Robert and Oler Jane
Home Financials for this Owner
Home Financials are based on the most recent Mortgage that was taken out on this home.
Original Mortgage
$35,000
Interest Rate
8.73%
Mortgage Type
New Conventional
Purchase Details
Closed on
Jul 13, 1993
Bought by
Hughes Katrina C
Purchase Details
Closed on
Jun 16, 1989
Bought by
Stennett Bryan T and Stennett Susan E
Purchase Details
Closed on
Mar 1, 1989
Bought by
Charles Mary Lee
Purchase Details
Closed on
Dec 16, 1986
Bought by
Nigh Nick Edwin
Purchase Details
Closed on
Apr 27, 1984
Bought by
Padgett James C
Create a Home Valuation Report for This Property
The Home Valuation Report is an in-depth analysis detailing your home's value as well as a comparison with similar homes in the area
Home Values in the Area
Average Home Value in this Area
Purchase History
| Date | Buyer | Sale Price | Title Company |
|---|---|---|---|
| Oler Investment Properties Ltd | -- | Attorney | |
| Oler Robert | $40,500 | -- | |
| Hughes Katrina C | $39,000 | -- | |
| Stennett Bryan T | $32,900 | -- | |
| Charles Mary Lee | $30,000 | -- | |
| Nigh Nick Edwin | $21,500 | -- | |
| Padgett James C | $15,500 | -- |
Source: Public Records
Mortgage History
| Date | Status | Borrower | Loan Amount |
|---|---|---|---|
| Previous Owner | Oler Robert | $35,000 |
Source: Public Records
Tax History Compared to Growth
Tax History
| Year | Tax Paid | Tax Assessment Tax Assessment Total Assessment is a certain percentage of the fair market value that is determined by local assessors to be the total taxable value of land and additions on the property. | Land | Improvement |
|---|---|---|---|---|
| 2024 | $1,226 | $33,620 | $4,660 | $28,960 |
| 2023 | $1,228 | $33,620 | $4,660 | $28,960 |
| 2022 | $1,223 | $33,620 | $4,660 | $28,960 |
| 2021 | $1,119 | $26,790 | $4,660 | $22,130 |
| 2020 | $1,119 | $26,790 | $4,660 | $22,130 |
| 2019 | $1,097 | $26,790 | $4,660 | $22,130 |
| 2018 | $993 | $22,260 | $4,240 | $18,020 |
| 2017 | $994 | $22,260 | $4,240 | $18,020 |
| 2016 | $991 | $22,260 | $4,240 | $18,020 |
| 2015 | $992 | $22,060 | $4,620 | $17,440 |
| 2014 | $992 | $22,060 | $4,620 | $17,440 |
| 2012 | $1,000 | $22,060 | $4,620 | $17,440 |
Source: Public Records
Map
Nearby Homes
- 420 Allen Ave
- 334 E Foulke Ave
- 230 Midland Ave
- 715 Christina Ct
- 206 Midland Ave
- 1010 Brenda Ct
- 1908 Gayle Ln
- 1825 Pershing St
- 115 George St
- 1062 Vincent St
- 600 Charles Ave
- 716 Winfield Ave
- 247 Crystal Ave
- 1820 N Main St
- 0 Sheridan Ave
- 2100 Candlewick Dr
- 207 Ash Ave
- 1934 Geffs Ave
- 1216 Concord Ct
- 0 E Melrose Ave
- 407 E Foulke Ave
- 419 E Foulke Ave
- 1314 N Blanchard St
- 401 E Foulke Ave
- 404 E Foulke Ave
- 1400 N Blanchard St
- 503 E Foulke Ave
- 408 Allen Ave
- 349 E Foulke Ave
- 416 Allen Ave
- 410 E Foulke Ave
- 408 E Foulke Ave
- 426 Allen Ave
- 345 E Foulke Ave
- 400 E Foulke Ave
- 1414 N Blanchard St
- 509 E Foulke Ave
- 1315 N Blanchard St
- 340 Allen Ave
- 402 Allen Ave