Estimated Value: $593,424 - $741,000
3
Beds
2
Baths
3,374
Sq Ft
$193/Sq Ft
Est. Value
About This Home
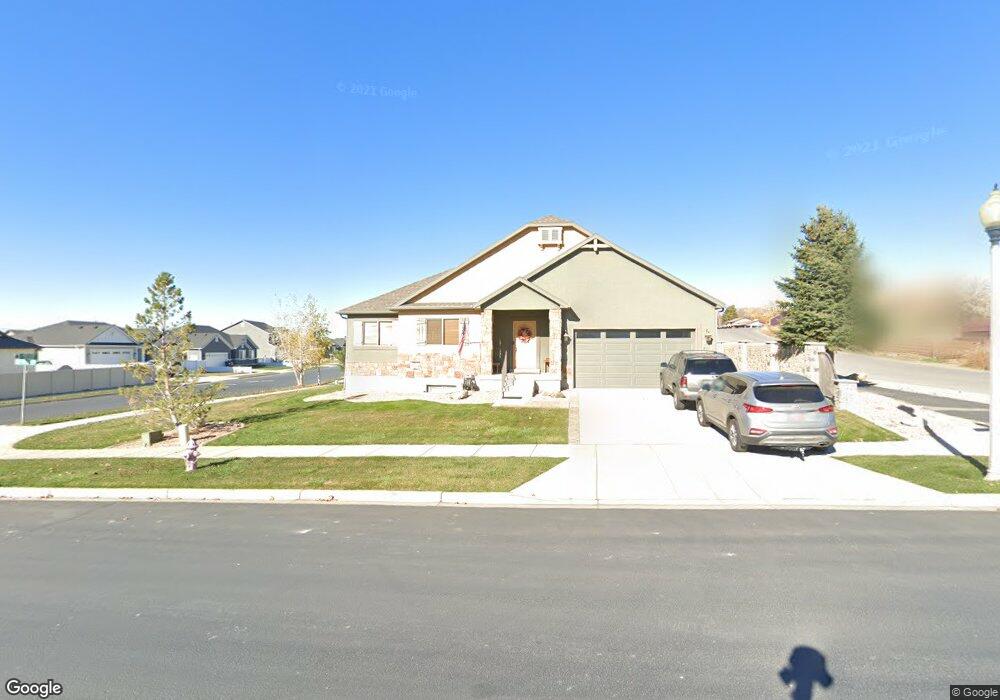
This home is located at 411 E Salem Park Cir, Salem, UT 84653 and is currently estimated at $650,106, approximately $192 per square foot. 411 E Salem Park Cir is a home located in Utah County with nearby schools including Salem Elementary, Salem Junior High School, and Valley View Middle School.
Ownership History
Date
Name
Owned For
Owner Type
Purchase Details
Closed on
Jan 26, 2021
Sold by
Davidson James and Davidson Nelda
Bought by
Jim And Nelda Davidson Living Trust and Davidson
Current Estimated Value
Purchase Details
Closed on
Jan 25, 2021
Sold by
Davidson James and Davidson Nelda
Bought by
Davidson James and Davidson Nelda
Purchase Details
Closed on
Oct 28, 2019
Sold by
Utah Lifestyle Property Management Llc
Bought by
Davidson James and Davidson Nelda
Purchase Details
Closed on
Nov 2, 2018
Sold by
Utah Property Management Llc
Bought by
Davidson James and Davidson Nelda
Purchase Details
Closed on
Sep 13, 2016
Sold by
Curley Brian S
Bought by
Utah Lifestyle Property Management Llc
Purchase Details
Closed on
Jun 11, 2009
Sold by
Whitmore James M
Bought by
Curley Brian S
Home Financials for this Owner
Home Financials are based on the most recent Mortgage that was taken out on this home.
Original Mortgage
$75,000
Interest Rate
4.82%
Mortgage Type
Purchase Money Mortgage
Purchase Details
Closed on
Dec 22, 2008
Sold by
Utah Lifestyle Homes Inc
Bought by
Whitmore James M
Create a Home Valuation Report for This Property
The Home Valuation Report is an in-depth analysis detailing your home's value as well as a comparison with similar homes in the area
Home Values in the Area
Average Home Value in this Area
Purchase History
| Date | Buyer | Sale Price | Title Company |
|---|---|---|---|
| Jim And Nelda Davidson Living Trust | -- | None Listed On Document | |
| Davidson James | -- | None Available | |
| Davidson James | -- | Accommodation | |
| Davidson James | -- | Accommodation | |
| Utah Lifestyle Property Management Llc | -- | Accommodation | |
| Curley Brian S | -- | Us Title Insurance Agency | |
| Whitmore James M | -- | Integrated Title Insurance | |
| Utah Lifestyle Homes Inc | -- | Integrated Title Insurance |
Source: Public Records
Mortgage History
| Date | Status | Borrower | Loan Amount |
|---|---|---|---|
| Previous Owner | Curley Brian S | $75,000 |
Source: Public Records
Tax History Compared to Growth
Tax History
| Year | Tax Paid | Tax Assessment Tax Assessment Total Assessment is a certain percentage of the fair market value that is determined by local assessors to be the total taxable value of land and additions on the property. | Land | Improvement |
|---|---|---|---|---|
| 2025 | $2,581 | $514,500 | $189,800 | $324,700 |
| 2024 | $2,581 | $261,745 | $0 | $0 |
| 2023 | $2,640 | $268,235 | $0 | $0 |
| 2022 | $2,921 | $292,215 | $0 | $0 |
| 2021 | $2,393 | $384,100 | $125,800 | $258,300 |
| 2020 | $2,354 | $367,600 | $114,400 | $253,200 |
| 2019 | $2,128 | $339,400 | $114,400 | $225,000 |
| 2018 | $2,084 | $317,700 | $112,300 | $205,400 |
| 2017 | $2,047 | $166,430 | $0 | $0 |
| 2016 | $1,806 | $145,145 | $0 | $0 |
| 2015 | $1,764 | $139,260 | $0 | $0 |
| 2014 | $1,642 | $129,800 | $0 | $0 |
Source: Public Records
Map
Nearby Homes
- 1412 N 290 E Unit 5
- 1212 N 290 E Unit 70
- 1226 N 290 E Unit 69
- 1428 N 290 E Unit 4
- 1463 N 290 E Unit 1
- 1427 N 290 E Unit 2
- 1203 N 290 E Unit 66
- 1411 N 290 E Unit 3
- Konlee Plan at Arrowhead Subdivision
- Thomas Plan at Arrowhead Subdivision
- Aaron Plan at Arrowhead Subdivision
- Stockton Plan at Arrowhead Subdivision
- Rear Load Townhome Plan at Juniper Ridge
- 198 E Wood Thrush Cove
- 373 E 1480 N Unit 43
- 361 E 1480 N Unit 41
- 367 E 1480 N Unit 42
- 357 E 1480 N Unit 40
- 353 E 1480 N Unit 39
- 336 E 1480 N Unit 50
- 1736 N Warbler Rd Unit 73
- 383 E Salem Park Cir
- 1748 N Warbler Rd Unit 74
- 412 E Salem Park Cir
- 398 E Salem Park Cir
- 1737 N Warbler Rd
- 1737 N Warbler Rd Unit 72
- 369 E Salem Park Cir
- 384 E Salem Park Cir
- 384 E Salem Park Cir Unit 3
- 1749 N Warbler Rd Unit 71
- 1764 N Warbler Rd Unit 75
- 368 E Salem Park Cir
- 413 E Wood Thrush Cove
- 1734 N Curlew Way Unit 12
- 355 E Salem Park Cir
- 1765 N Warbler Rd Unit 70
- 403 E Wood Thrush Cove
- 1748 N Curlew Way Unit AUBREY
- 387 E Wood Thrush Cove Unit 106