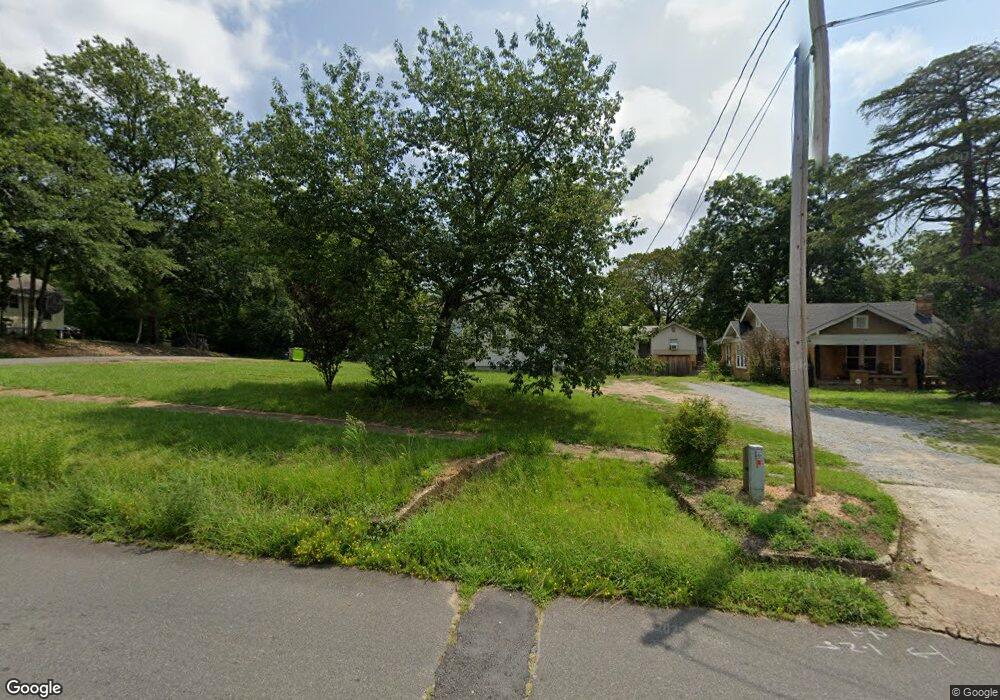
411 E South St Benton, AR 72015
Estimated Value: $94,555 - $135,000
--
Bed
1
Bath
820
Sq Ft
$143/Sq Ft
Est. Value
About This Home
This home is located at 411 E South St, Benton, AR 72015 and is currently estimated at $116,889, approximately $142 per square foot. 411 E South St is a home located in Saline County with nearby schools including Angie Grant Elementary School, Benton Middle School, and Benton Junior High School.
Ownership History
Date
Name
Owned For
Owner Type
Purchase Details
Closed on
Apr 17, 2017
Sold by
Sheridan Vivian A and Sheridan Gary C
Bought by
Marvel Investments Llc
Current Estimated Value
Home Financials for this Owner
Home Financials are based on the most recent Mortgage that was taken out on this home.
Original Mortgage
$24,000
Interest Rate
4.21%
Mortgage Type
Future Advance Clause Open End Mortgage
Purchase Details
Closed on
Aug 9, 2006
Sold by
Saline River Realty L P
Bought by
Sheridan Gary C and Sheridan Vivian A
Home Financials for this Owner
Home Financials are based on the most recent Mortgage that was taken out on this home.
Original Mortgage
$33,200
Interest Rate
6.77%
Mortgage Type
New Conventional
Purchase Details
Closed on
Jan 28, 2003
Bought by
Saline Rr
Purchase Details
Closed on
Aug 6, 2001
Bought by
Scott and Donner
Create a Home Valuation Report for This Property
The Home Valuation Report is an in-depth analysis detailing your home's value as well as a comparison with similar homes in the area
Home Values in the Area
Average Home Value in this Area
Purchase History
| Date | Buyer | Sale Price | Title Company |
|---|---|---|---|
| Marvel Investments Llc | $30,000 | None Available | |
| Sheridan Gary C | $42,000 | -- | |
| Saline Rr | $11,000 | -- | |
| Scott | -- | -- |
Source: Public Records
Mortgage History
| Date | Status | Borrower | Loan Amount |
|---|---|---|---|
| Closed | Marvel Investments Llc | $24,000 | |
| Previous Owner | Sheridan Gary C | $33,200 |
Source: Public Records
Tax History Compared to Growth
Tax History
| Year | Tax Paid | Tax Assessment Tax Assessment Total Assessment is a certain percentage of the fair market value that is determined by local assessors to be the total taxable value of land and additions on the property. | Land | Improvement |
|---|---|---|---|---|
| 2025 | $665 | $14,841 | $3,000 | $11,841 |
| 2024 | $680 | $14,841 | $3,000 | $11,841 |
| 2023 | $614 | $14,841 | $3,000 | $11,841 |
| 2022 | $563 | $14,841 | $3,000 | $11,841 |
| 2021 | $512 | $9,240 | $1,600 | $7,640 |
| 2020 | $512 | $9,240 | $1,600 | $7,640 |
| 2019 | $512 | $9,240 | $1,600 | $7,640 |
| 2018 | $511 | $9,240 | $1,600 | $7,640 |
| 2017 | $511 | $9,240 | $1,600 | $7,640 |
| 2016 | $536 | $9,450 | $1,600 | $7,850 |
| 2015 | $530 | $9,450 | $1,600 | $7,850 |
| 2014 | $530 | $9,450 | $1,600 | $7,850 |
Source: Public Records
Map
Nearby Homes