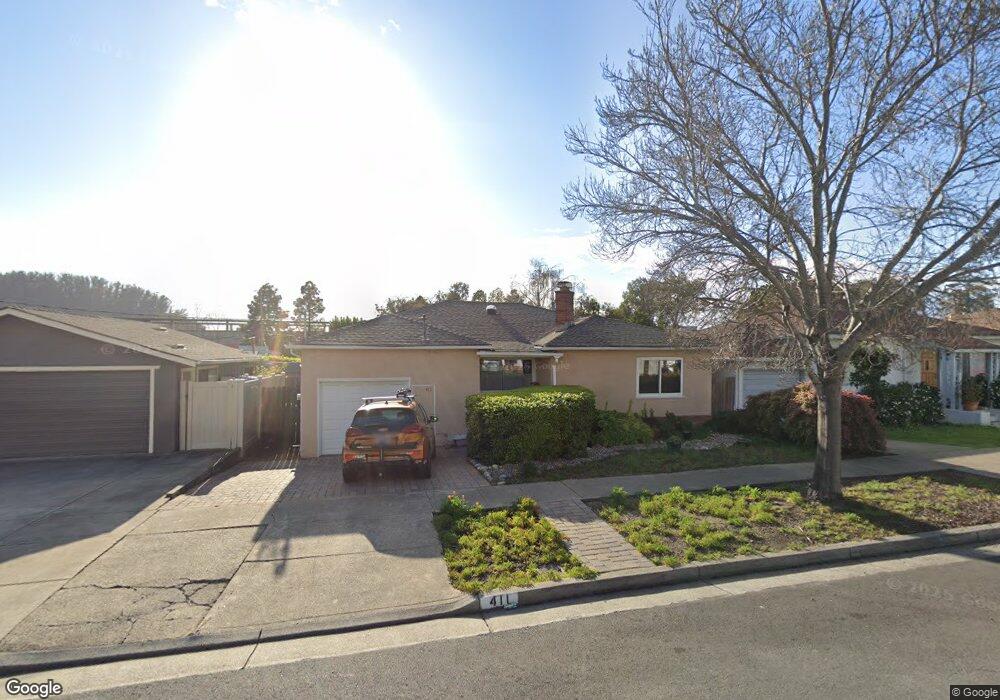
411 Everett St El Cerrito, CA 94530
Estimated Value: $1,084,000 - $1,395,000
3
Beds
2
Baths
1,554
Sq Ft
$769/Sq Ft
Est. Value
About This Home
This home is located at 411 Everett St, El Cerrito, CA 94530 and is currently estimated at $1,195,738, approximately $769 per square foot. 411 Everett St is a home located in Contra Costa County with nearby schools including Harding Elementary School, Fred T. Korematsu Middle School, and El Cerrito Senior High School.
Ownership History
Date
Name
Owned For
Owner Type
Purchase Details
Closed on
Apr 15, 2021
Sold by
Okimoto and Rochelle
Bought by
Takashi And Rochelle Okimoto Living Trust
Current Estimated Value
Purchase Details
Closed on
Apr 2, 2008
Sold by
Ramos Bradley J
Bought by
Okimoto Takashi and Pardue Okimoto Rochelle
Home Financials for this Owner
Home Financials are based on the most recent Mortgage that was taken out on this home.
Original Mortgage
$417,000
Interest Rate
6.04%
Mortgage Type
Purchase Money Mortgage
Purchase Details
Closed on
Jul 16, 2007
Sold by
Patrick Ramos Lisa
Bought by
Ramos Bradley J
Home Financials for this Owner
Home Financials are based on the most recent Mortgage that was taken out on this home.
Original Mortgage
$390,000
Interest Rate
6.51%
Mortgage Type
Purchase Money Mortgage
Create a Home Valuation Report for This Property
The Home Valuation Report is an in-depth analysis detailing your home's value as well as a comparison with similar homes in the area
Home Values in the Area
Average Home Value in this Area
Purchase History
| Date | Buyer | Sale Price | Title Company |
|---|---|---|---|
| Takashi And Rochelle Okimoto Living Trust | -- | -- | |
| Okimoto Takashi | $588,000 | Chicago Title Company | |
| Ramos Bradley J | -- | North American Title Co | |
| Ramos Bradley J | $450,000 | North American Title Co |
Source: Public Records
Mortgage History
| Date | Status | Borrower | Loan Amount |
|---|---|---|---|
| Previous Owner | Okimoto Takashi | $417,000 | |
| Previous Owner | Ramos Bradley J | $390,000 |
Source: Public Records
Tax History
| Year | Tax Paid | Tax Assessment Tax Assessment Total Assessment is a certain percentage of the fair market value that is determined by local assessors to be the total taxable value of land and additions on the property. | Land | Improvement |
|---|---|---|---|---|
| 2025 | $11,015 | $772,332 | $632,453 | $139,879 |
| 2024 | $10,567 | $757,189 | $620,052 | $137,137 |
| 2023 | $10,567 | $742,344 | $607,895 | $134,449 |
| 2022 | $10,413 | $727,789 | $595,976 | $131,813 |
| 2021 | $10,373 | $713,520 | $584,291 | $129,229 |
| 2019 | $9,731 | $692,358 | $566,961 | $125,397 |
| 2018 | $9,394 | $678,784 | $555,845 | $122,939 |
| 2017 | $9,245 | $665,476 | $544,947 | $120,529 |
| 2016 | $9,216 | $652,428 | $534,262 | $118,166 |
| 2015 | $9,254 | $642,629 | $526,237 | $116,392 |
| 2014 | $9,158 | $630,042 | $515,929 | $114,113 |
Source: Public Records
Map
Nearby Homes
- 305 Coronado St
- 532 Lexington Ave
- 535 Ashbury Ave
- 6016 Avila St
- 417 Evelyn Ave Unit 205
- 6130 Van Fleet Ave
- 5814 El Dorado St
- 5720 El Dorado Ave
- 606 Masonic Ave
- 5600 El Dorado St
- 535 Pierce St Unit 5109
- 535 Pierce St Unit 2110
- 535 Pierce St Unit 3114
- 931 Elm St
- 720 Key Route Blvd
- 953 Hillside Ave
- 545 Pierce St Unit 1206
- 728 Stannage Ave
- 7603 Terrace Dr
- 5622 Huntington Ave
- 415 Everett St
- 6813 Fairmount Ave
- 6831 Fairmount Ave
- 6811 Fairmount Ave
- 412 Richmond St
- 417 Everett St
- 414 Richmond St
- 418 Richmond St
- 6901 Fairmount Ave
- 419 Everett St
- 422 Richmond St
- 410 Everett St
- 412 Everett St
- 6905 Fairmount Ave
- 423 Everett St
- 418 Everett St
- 424 Richmond St
- 6911 Fairmount Ave
- 332 Coronado St
- 422 Everett St
Your Personal Tour Guide
Ask me questions while you tour the home.