Estimated Value: $215,000 - $256,000
3
Beds
2
Baths
1,800
Sq Ft
$134/Sq Ft
Est. Value
About This Home
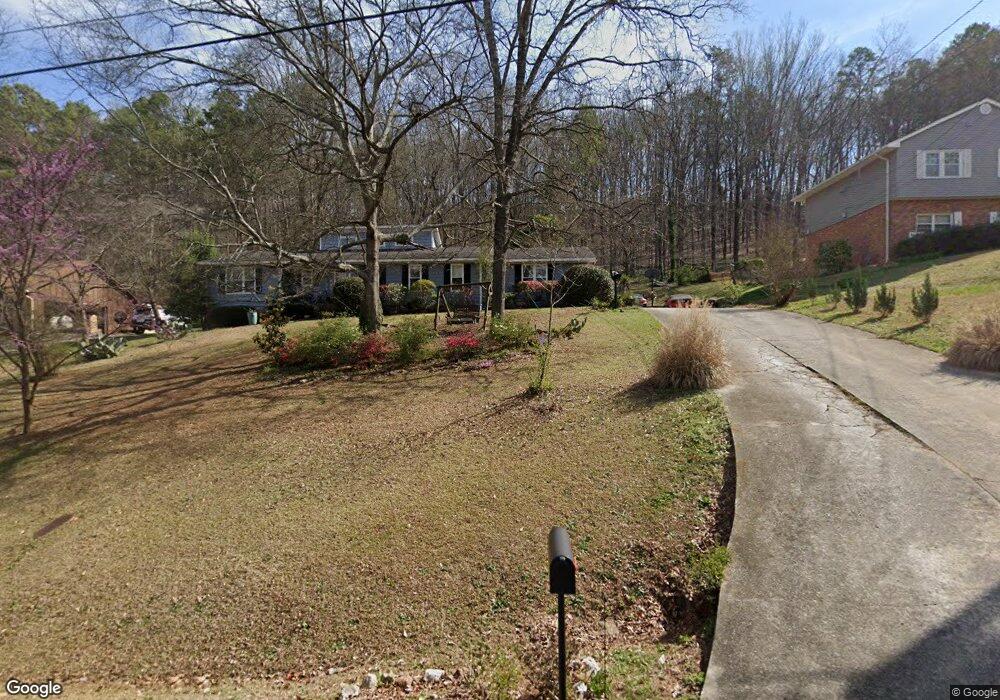
This home is located at 411 Flora Ave Extension SE, Rome, GA 30161 and is currently estimated at $241,474, approximately $134 per square foot. 411 Flora Ave Extension SE is a home located in Floyd County with nearby schools including Pepperell Middle School, Pepperell High School, and Montessori School of Rome.
Ownership History
Date
Name
Owned For
Owner Type
Purchase Details
Closed on
Oct 7, 2005
Sold by
Sec Of Housing & U
Bought by
Pilgrim James Harold
Current Estimated Value
Home Financials for this Owner
Home Financials are based on the most recent Mortgage that was taken out on this home.
Original Mortgage
$102,350
Outstanding Balance
$54,437
Interest Rate
5.66%
Mortgage Type
New Conventional
Estimated Equity
$187,037
Purchase Details
Closed on
Apr 5, 2005
Sold by
Mtg Electronic Registratio
Bought by
Sec Of Housing & Urban
Purchase Details
Closed on
Jul 15, 2004
Sold by
Ely Debra Jean
Bought by
Millsap Jennifer Litton and Millsap Zachary W
Purchase Details
Closed on
Feb 3, 1988
Sold by
Boling Wh
Bought by
Ely Debra Jean
Purchase Details
Closed on
Sep 6, 1983
Sold by
Terry John C and Terry Trennette
Bought by
Boling Wh
Purchase Details
Closed on
Jun 17, 1977
Sold by
Robinson Herman
Bought by
Terry John C and Terry Trennette
Purchase Details
Closed on
Jul 9, 1973
Bought by
Robinson Herman
Create a Home Valuation Report for This Property
The Home Valuation Report is an in-depth analysis detailing your home's value as well as a comparison with similar homes in the area
Home Values in the Area
Average Home Value in this Area
Purchase History
| Date | Buyer | Sale Price | Title Company |
|---|---|---|---|
| Pilgrim James Harold | -- | -- | |
| Sec Of Housing & Urban | $131,374 | -- | |
| Mtg Electronic Registration Sy | $131,374 | -- | |
| Millsap Jennifer Litton | $126,000 | -- | |
| Ely Debra Jean | $58,000 | -- | |
| Boling Wh | $47,000 | -- | |
| Terry John C | $45,000 | -- | |
| Robinson Herman | -- | -- |
Source: Public Records
Mortgage History
| Date | Status | Borrower | Loan Amount |
|---|---|---|---|
| Open | Pilgrim James Harold | $102,350 |
Source: Public Records
Tax History Compared to Growth
Tax History
| Year | Tax Paid | Tax Assessment Tax Assessment Total Assessment is a certain percentage of the fair market value that is determined by local assessors to be the total taxable value of land and additions on the property. | Land | Improvement |
|---|---|---|---|---|
| 2024 | $1,753 | $69,708 | $12,250 | $57,458 |
| 2023 | $1,717 | $67,274 | $11,136 | $56,138 |
| 2022 | $1,595 | $57,570 | $8,909 | $48,661 |
| 2021 | $1,496 | $52,149 | $8,909 | $43,240 |
| 2020 | $1,360 | $45,564 | $6,682 | $38,882 |
| 2019 | $1,297 | $44,173 | $6,682 | $37,491 |
| 2018 | $1,253 | $42,713 | $6,682 | $36,031 |
| 2017 | $1,199 | $40,828 | $6,682 | $34,146 |
| 2016 | $1,205 | $40,552 | $6,680 | $33,872 |
| 2015 | $1,194 | $41,032 | $6,680 | $34,352 |
| 2014 | $1,194 | $40,924 | $6,680 | $34,244 |
Source: Public Records
Map
Nearby Homes
- 3014 Maple Rd SE
- 409 Flora Ave SE
- 13 Spring Cir SE
- 2812 Maple Rd SE
- 33 Summit Dr
- 106 Sunset Dr SE
- 226 Flora Ave SE
- 2710 Maple Rd SE
- 212 Alfred Ave SE
- 36 Saddle Mountain Rd SE
- 211 Alfred Ave SE
- 2523 Maple Rd SE
- 27 Saddle Mountain Rd SE
- 270 N Edenfield Ridge Dr SE
- 2508 Maple Rd SE
- 52 Twickenham Rd SE
- 3 Belmont Ct SE
- 2501 Maple Rd SE
- 15 Saddlebrook Dr SE
- 280 Ravenwood Dr SE
- 411 Flora Ave Extension SE
- 409 Flora Ave Extension SE
- 409 Flora Ave Extension SE
- 413 Flora Ave Extension SE
- 415 Flora Ave Extension SE
- 414 Flora Ave Extension SE
- 408 Flora Ave Extension SE
- 408 Flora Ave Extension SE
- 407 Flora Ave SE
- 407 Flora Ave
- 407B Flora Ave Extension SE
- 407 Flora Ave Extension SE
- 3015 Maple Rd SE
- 416 Flora Ave Extension SE
- 416 Flora Ave Extension SE Unit EXTENSIO
- 416 Flora Ave Extension SE
- 3013 Maple Rd SE
- 416 Flora Ave Extension SE
- 3011 Maple Rd SE
- 3019 Maple Rd SE