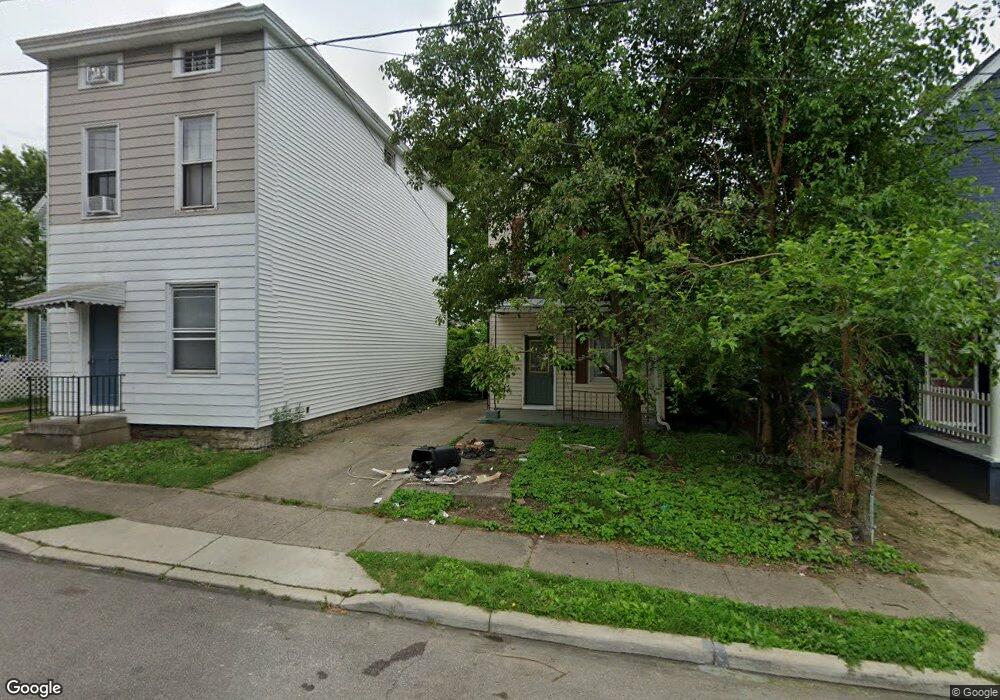
411 Linden St Cincinnati, OH 45216
Estimated Value: $119,054 - $207,000
4
Beds
2
Baths
1,792
Sq Ft
$86/Sq Ft
Est. Value
About This Home
This home is located at 411 Linden St, Cincinnati, OH 45216 and is currently estimated at $154,014, approximately $85 per square foot. 411 Linden St is a home located in Hamilton County with nearby schools including Elmwood Place Elementary School, St Bernard-Elmwood Place High School, and Regeneration Bond Hill.
Ownership History
Date
Name
Owned For
Owner Type
Purchase Details
Closed on
Oct 9, 2007
Sold by
Aegis Mortgage Corp
Bought by
Gowda Neil E
Current Estimated Value
Home Financials for this Owner
Home Financials are based on the most recent Mortgage that was taken out on this home.
Original Mortgage
$22,050
Interest Rate
6.38%
Mortgage Type
Unknown
Purchase Details
Closed on
Apr 9, 2007
Sold by
Cash Stanhope and Morgan James
Bought by
Aegis Mortgage Corp
Purchase Details
Closed on
Aug 4, 2005
Sold by
Morgan Sharon B and Morgan James B
Bought by
Cash Stanhope
Home Financials for this Owner
Home Financials are based on the most recent Mortgage that was taken out on this home.
Original Mortgage
$88,000
Interest Rate
7.83%
Mortgage Type
Fannie Mae Freddie Mac
Purchase Details
Closed on
Jun 17, 2002
Sold by
Morgan Sharon B
Bought by
Morgan Sharon B and Morgan James B
Create a Home Valuation Report for This Property
The Home Valuation Report is an in-depth analysis detailing your home's value as well as a comparison with similar homes in the area
Home Values in the Area
Average Home Value in this Area
Purchase History
| Date | Buyer | Sale Price | Title Company |
|---|---|---|---|
| Gowda Neil E | $22,050 | Attorney | |
| Aegis Mortgage Corp | $50,000 | None Available | |
| Cash Stanhope | $110,000 | Precision Land Title | |
| Morgan Sharon B | -- | -- | |
| Morgan Sharon B | -- | -- |
Source: Public Records
Mortgage History
| Date | Status | Borrower | Loan Amount |
|---|---|---|---|
| Previous Owner | Gowda Neil E | $22,050 | |
| Previous Owner | Cash Stanhope | $88,000 |
Source: Public Records
Tax History
| Year | Tax Paid | Tax Assessment Tax Assessment Total Assessment is a certain percentage of the fair market value that is determined by local assessors to be the total taxable value of land and additions on the property. | Land | Improvement |
|---|---|---|---|---|
| 2025 | $1,671 | $23,258 | $3,213 | $20,045 |
| 2023 | $1,684 | $23,258 | $3,213 | $20,045 |
| 2022 | $1,262 | $12,849 | $2,569 | $10,280 |
| 2021 | $1,149 | $12,849 | $2,569 | $10,280 |
| 2020 | $1,110 | $12,849 | $2,569 | $10,280 |
| 2019 | $1,195 | $12,849 | $2,569 | $10,280 |
| 2018 | $1,212 | $12,849 | $2,569 | $10,280 |
| 2017 | $1,143 | $12,849 | $2,569 | $10,280 |
| 2016 | $1,229 | $13,752 | $2,958 | $10,794 |
| 2015 | $1,147 | $13,752 | $2,958 | $10,794 |
| 2014 | $1,145 | $13,752 | $2,958 | $10,794 |
| 2013 | $1,212 | $14,945 | $3,213 | $11,732 |
Source: Public Records
Map
Nearby Homes
- 6011 Vine St
- 412 Lombardy St
- 409 Maple St
- 524 Maple St
- 6310 Vine St
- 121 64th St
- 106 Township Ave
- 107 W Sixty Fifth St
- 14 Township Ave
- 1 Spruce St
- 0 Township Road 111
- 206 W 69th St
- 116 W 70th St
- 7123 Fairpark Ave
- 120 W Seventy Second St
- 1100 Carolina Ave
- 3 W 73rd St
- 14 W Seventy Third St
- 1144 Carolina Ave
- 1303 Regent Ave
- 409 Linden St
- 413 Linden St
- 407 Linden St
- 5914 Highland Ave
- 403 Linden St
- 5912 Highland Ave
- 412 Locust St
- 5910 Highland Ave
- 5910 Highland Ave
- 5906 Highland Ave
- 401 Linden St
- 5900 Highland Ave
- 5904 Highland Ave
- 410 Linden St
- 412 Linden St
- 6002 Highland Ave
- 406 Linden St
- 5917 Vine St
- 404 Linden St
- 6006 Highland Ave
Your Personal Tour Guide
Ask me questions while you tour the home.