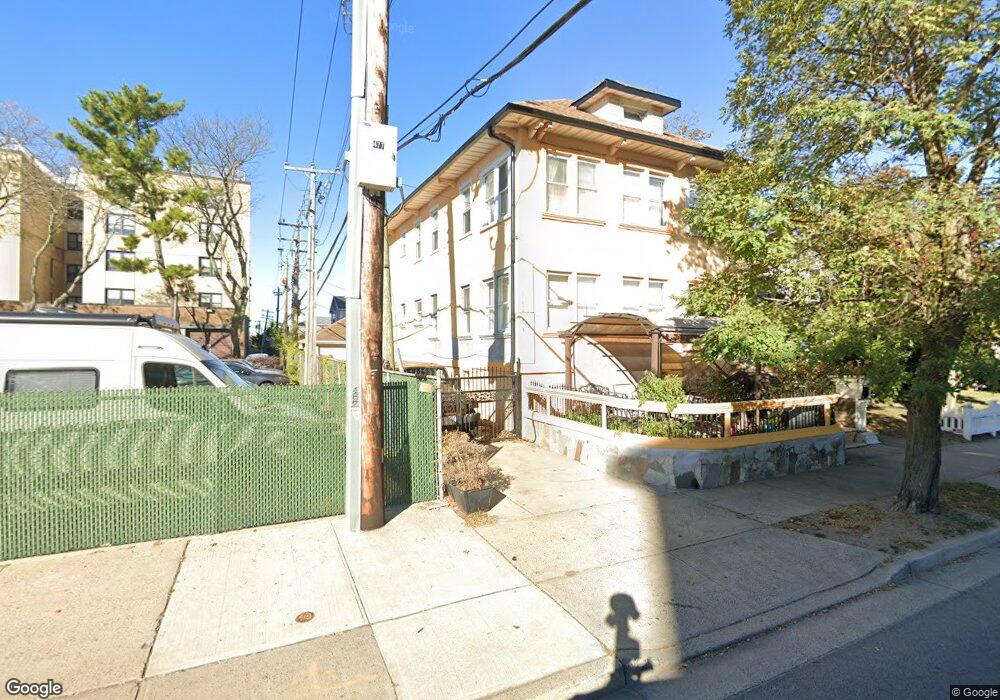
411 Magnolia Blvd Unit Upper Long Beach, NY 11561
Estimated Value: $725,000 - $987,430
3
Beds
1
Bath
2,704
Sq Ft
$317/Sq Ft
Est. Value
About This Home
This home is located at 411 Magnolia Blvd Unit Upper, Long Beach, NY 11561 and is currently estimated at $856,215, approximately $316 per square foot. 411 Magnolia Blvd Unit Upper is a home located in Nassau County with nearby schools including Lido Elementary School, Lindell Elementary School, and East Elementary School.
Ownership History
Date
Name
Owned For
Owner Type
Purchase Details
Closed on
Nov 30, 2022
Sold by
Singh Rupdai
Bought by
Singh Rupdai and Wolfe Solachnie
Current Estimated Value
Purchase Details
Closed on
Apr 2, 2010
Sold by
Defreitas Francene and Feroze Mohamed
Bought by
Singh Rupdai and Singh Deowanarine
Purchase Details
Closed on
Sep 14, 2005
Sold by
Shakur Mohamed
Purchase Details
Closed on
Dec 17, 1998
Sold by
Parkside Holding Corp
Bought by
Feroce Mohamed and Defreitas Francene
Purchase Details
Closed on
Jun 10, 1998
Sold by
Laspina Leonor
Bought by
Lincoln Equitries Inc
Purchase Details
Closed on
May 7, 1996
Sold by
Salzberg Jan and Salzberg Lisa
Bought by
Laspina Leonor
Home Financials for this Owner
Home Financials are based on the most recent Mortgage that was taken out on this home.
Original Mortgage
$60,000
Interest Rate
8.21%
Create a Home Valuation Report for This Property
The Home Valuation Report is an in-depth analysis detailing your home's value as well as a comparison with similar homes in the area
Home Values in the Area
Average Home Value in this Area
Purchase History
| Date | Buyer | Sale Price | Title Company |
|---|---|---|---|
| Singh Rupdai | -- | None Available | |
| Singh Rupdai | -- | None Available | |
| Singh Rupdai | $300,000 | -- | |
| Singh Rupdai | $300,000 | -- | |
| -- | -- | -- | |
| -- | -- | -- | |
| Feroce Mohamed | $270,000 | -- | |
| Feroce Mohamed | $270,000 | -- | |
| Lincoln Equitries Inc | $102,000 | -- | |
| Lincoln Equitries Inc | $102,000 | -- | |
| Laspina Leonor | $120,000 | -- | |
| Laspina Leonor | $120,000 | -- |
Source: Public Records
Mortgage History
| Date | Status | Borrower | Loan Amount |
|---|---|---|---|
| Previous Owner | Laspina Leonor | $60,000 |
Source: Public Records
Tax History Compared to Growth
Tax History
| Year | Tax Paid | Tax Assessment Tax Assessment Total Assessment is a certain percentage of the fair market value that is determined by local assessors to be the total taxable value of land and additions on the property. | Land | Improvement |
|---|---|---|---|---|
| 2025 | $9,820 | $682 | $233 | $449 |
| 2024 | $1,275 | $682 | $233 | $449 |
| 2023 | $10,191 | $682 | $233 | $449 |
| 2022 | $10,191 | $682 | $233 | $449 |
| 2021 | $20,460 | $653 | $223 | $430 |
| 2020 | $15,688 | $1,199 | $761 | $438 |
| 2019 | $11,254 | $1,199 | $761 | $438 |
| 2018 | $10,657 | $1,199 | $0 | $0 |
| 2017 | $7,978 | $1,199 | $761 | $438 |
| 2016 | $1,480 | $1,199 | $761 | $438 |
| 2015 | $1,472 | $1,199 | $761 | $438 |
| 2014 | $1,472 | $1,199 | $761 | $438 |
| 2013 | $1,407 | $1,199 | $761 | $438 |
Source: Public Records
Map
Nearby Homes
- 245 W Chester St
- 235 W Park Ave Unit 503
- 185 W Park Ave Unit 209
- 237 W Walnut St
- 122 W Walnut St
- 161 W Beech St
- 236 W Pine St
- 230 W Beech St
- 211 Laurelton Blvd
- 328 W Fulton St
- 227 W Pine St
- 274 W Beech St
- 61 W Walnut St
- 520 Lafayette Blvd
- 235 W Broadway Unit A-3
- 65 W Beech St
- 56 W Beech St
- 260 W Broadway Unit 2G
- 260 W Broadway Unit 2B
- 430 W Walnut St
- 411 Magnolia Blvd
- 421 Magnolia Blvd
- 212 W Chester St
- 0 Magnolia Blvd Unit B
- 218 W Chester St
- 453 Magnolia Blvd
- 224 W Chester St
- 211 W Chester St
- 228 W Chester St
- 459 Magnolia Blvd
- 215 W Chester St
- 217 W Chester St
- 185 W Park Ave Unit 104
- 185 W Park Ave Unit 414N
- 185 W Park Ave Unit 111
- 185 W Park Ave Unit 317
- 185 W Park Ave Unit 215
- 185 W Park Ave Unit 412
- 185 W Park Ave Unit 101
- 185 W Park Ave Unit 302