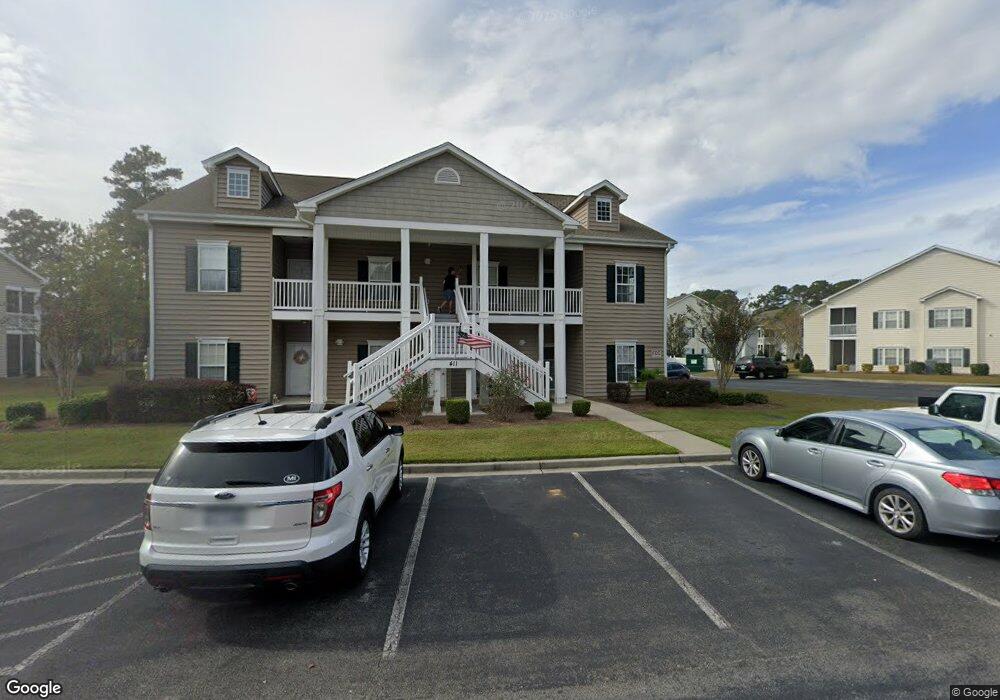
411 Mahogany Dr Unit 41110 Murrells Inlet, SC 29576
Burgess Neighborhood
3
Beds
2
Baths
1,411
Sq Ft
--
Built
About This Home
This home is located at 411 Mahogany Dr Unit 41110, Murrells Inlet, SC 29576. 411 Mahogany Dr Unit 41110 is a home located in Horry County with nearby schools including St. James Elementary School, St. James Middle School, and St. James Intermediate.
Create a Home Valuation Report for This Property
The Home Valuation Report is an in-depth analysis detailing your home's value as well as a comparison with similar homes in the area
Home Values in the Area
Average Home Value in this Area
Tax History Compared to Growth
Tax History
| Year | Tax Paid | Tax Assessment Tax Assessment Total Assessment is a certain percentage of the fair market value that is determined by local assessors to be the total taxable value of land and additions on the property. | Land | Improvement |
|---|---|---|---|---|
| 2024 | $1,048 | $10,196 | $0 | $10,196 |
| 2023 | $1,048 | $15,120 | $0 | $15,120 |
| 2021 | $2,686 | $15,120 | $0 | $15,120 |
| 2020 | $1,537 | $15,120 | $0 | $15,120 |
| 2019 | $1,537 | $15,120 | $0 | $15,120 |
| 2018 | $1,388 | $11,445 | $0 | $11,445 |
| 2017 | $1,373 | $6,540 | $0 | $6,540 |
| 2016 | -- | $6,540 | $0 | $6,540 |
| 2015 | $1,420 | $11,445 | $0 | $11,445 |
| 2014 | $1,373 | $6,540 | $0 | $6,540 |
Source: Public Records
Map
Nearby Homes
- 501 Aft Ct Unit 101
- 501 Aft Ct Unit 102
- 1845 Groveway Ct
- 314 Black Oak Ln Unit 102
- 319 Black Oak Ln Unit 101
- 806 Sail Ln Unit 202
- 237 Moonglow Cir Unit 102
- 448 Mahogany Dr Unit 201
- 332 Black Oak Ln Unit 102
- 5858 Longwood Dr Unit 201
- 5852 Longwood Dr Unit 302
- 5792 Longwood Dr Unit 302
- 1018 Red Sky Ln Unit 101
- 5632 S Blackmoor Dr
- 5804 Longwood Dr Unit 203
- 924 Jackline Place Unit 201
- 1111 N Blackmoor Dr
- 6578 Wellington Dr
- 1158 Kiawah Loop
- 1411 Gooseneck Place Unit 103
- 411 Mahogany Dr Unit 201 MARCLIFFE W
- 411 Mahogany Dr
- 411 Mahogany Dr Unit 41120
- 411 Mahogany Dr Unit 41120
- 411 Mahogany Dr Unit 41110
- 411 Mahogany Dr Unit 102
- 307 Black Oak Ln Unit 202
- 307 Black Oak Ln Unit 62-102 MARCLIFFE W
- 307 Black Oak Ln Unit 101
- 307 Black Oak Ln
- 307 Black Oak Ln Unit 30710
- 307 Black Oak Ln Unit 30720
- 307 Black Oak Ln Unit 30720
- 307 Black Oak Ln Unit 30710
- 401 Mahogany Dr Unit 101
- 401 Mahogany Dr Unit 102
- 401 Mahogany Dr
- 401 Mahogany Dr Unit BLG 18 Unit 101
- 401 Mahogany Dr Unit 40110
- 401 Mahogany Dr Unit 40120