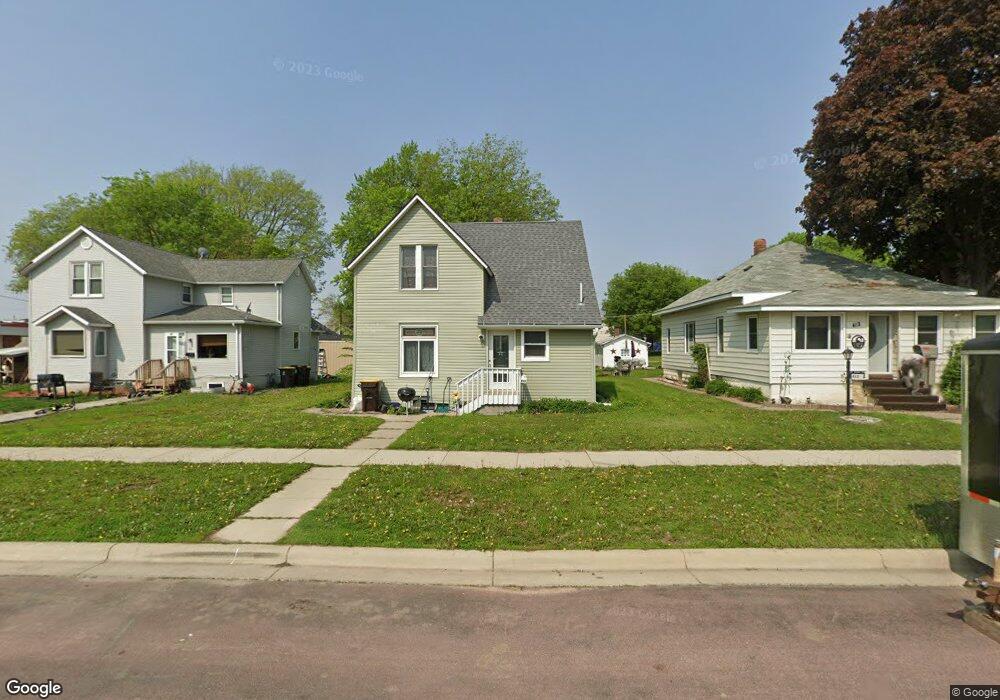
411 N Elm St Fairmont, MN 56031
Estimated Value: $90,000 - $124,841
3
Beds
2
Baths
1,119
Sq Ft
$97/Sq Ft
Est. Value
About This Home
This home is located at 411 N Elm St, Fairmont, MN 56031 and is currently estimated at $108,960, approximately $97 per square foot. 411 N Elm St is a home located in Martin County with nearby schools including Fairmont Elementary School, Fairmont Junior/Senior High School, and St. Paul Lutheran School.
Ownership History
Date
Name
Owned For
Owner Type
Purchase Details
Closed on
Sep 25, 2020
Sold by
Castillo Properites Llc
Bought by
Lintelman Elizabeth and Lintelman Seth
Current Estimated Value
Home Financials for this Owner
Home Financials are based on the most recent Mortgage that was taken out on this home.
Original Mortgage
$57,040
Outstanding Balance
$50,734
Interest Rate
2.9%
Mortgage Type
New Conventional
Estimated Equity
$58,226
Purchase Details
Closed on
May 10, 2019
Sold by
Bayview Loan Servicing Llc
Bought by
Castillo Properties Llc
Purchase Details
Closed on
Feb 22, 2018
Sold by
Hotovee Timothy A and Hotovee Bonnie E
Bought by
Bayview Loan Serving Llc
Purchase Details
Closed on
Dec 12, 2006
Sold by
Mileham Russell L and Mileham Russell Lloyd
Bought by
Hotovec Timothy A and Hotovec Bonnie E
Home Financials for this Owner
Home Financials are based on the most recent Mortgage that was taken out on this home.
Original Mortgage
$42,242
Interest Rate
6.33%
Mortgage Type
Purchase Money Mortgage
Create a Home Valuation Report for This Property
The Home Valuation Report is an in-depth analysis detailing your home's value as well as a comparison with similar homes in the area
Home Values in the Area
Average Home Value in this Area
Purchase History
| Date | Buyer | Sale Price | Title Company |
|---|---|---|---|
| Lintelman Elizabeth | $71,300 | Jenkinson Abstract Company | |
| Castillo Properties Llc | $12,000 | Fidelity Land Title Agency | |
| Bayview Loan Serving Llc | $15,200 | None Available | |
| Hotovec Timothy A | $34,000 | None Available |
Source: Public Records
Mortgage History
| Date | Status | Borrower | Loan Amount |
|---|---|---|---|
| Open | Lintelman Elizabeth | $57,040 | |
| Previous Owner | Hotovec Timothy A | $42,242 |
Source: Public Records
Tax History Compared to Growth
Tax History
| Year | Tax Paid | Tax Assessment Tax Assessment Total Assessment is a certain percentage of the fair market value that is determined by local assessors to be the total taxable value of land and additions on the property. | Land | Improvement |
|---|---|---|---|---|
| 2025 | $1,318 | $88,900 | $14,400 | $74,500 |
| 2024 | $1,140 | $92,800 | $14,400 | $78,400 |
| 2023 | $1,092 | $84,500 | $7,200 | $77,300 |
| 2022 | $816 | $74,900 | $8,000 | $66,900 |
| 2021 | $418 | $51,200 | $6,700 | $44,500 |
| 2020 | $858 | $25,000 | $6,700 | $18,300 |
| 2019 | $764 | $25,000 | $6,700 | $18,300 |
| 2018 | $646 | $18,800 | $5,100 | $13,700 |
| 2017 | $634 | $10,700 | $2,885 | $7,815 |
| 2016 | $654 | $11,800 | $3,175 | $8,625 |
| 2015 | $148 | $11,200 | $2,951 | $8,249 |
| 2013 | $241 | $15,500 | $2,992 | $12,508 |
Source: Public Records
Map
Nearby Homes
- 525 N Hampton St
- 302 E 1st St
- 609 E 4th St
- 323 E 9th St
- 620 E 3rd St
- 906 N Prairie Ave
- 227 S Elm St
- 115 S Orient St
- 431 Webster St
- 101 Albion Ave Unit 202
- 223 W 10th St
- 445 Lake Ave Unit 104
- 445 Lake Ave Unit 101
- 603 Webster St
- 418 Forest St
- 517 Willow St
- 515 S Hampton St
- 1219 N North Ave
- 835 S Park St
- 841 Redwood Dr