Estimated Value: $150,000 - $222,000
3
Beds
1
Bath
2,466
Sq Ft
$77/Sq Ft
Est. Value
About This Home
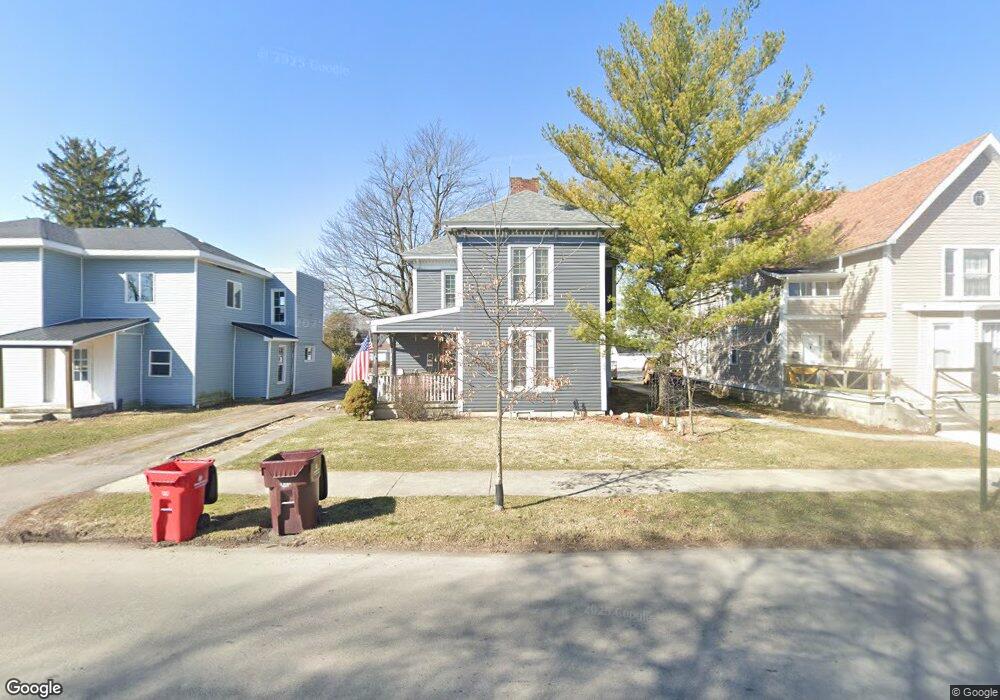
This home is located at 411 N Main St, Ada, OH 45810 and is currently estimated at $189,034, approximately $76 per square foot. 411 N Main St is a home located in Hardin County with nearby schools including Ada Elementary School and Ada High School.
Create a Home Valuation Report for This Property
The Home Valuation Report is an in-depth analysis detailing your home's value as well as a comparison with similar homes in the area
Home Values in the Area
Average Home Value in this Area
Tax History Compared to Growth
Tax History
| Year | Tax Paid | Tax Assessment Tax Assessment Total Assessment is a certain percentage of the fair market value that is determined by local assessors to be the total taxable value of land and additions on the property. | Land | Improvement |
|---|---|---|---|---|
| 2024 | $2,026 | $52,360 | $2,240 | $50,120 |
| 2023 | $2,026 | $52,360 | $2,240 | $50,120 |
| 2022 | $1,765 | $39,780 | $2,170 | $37,610 |
| 2021 | $1,936 | $39,780 | $2,170 | $37,610 |
| 2020 | $1,962 | $39,780 | $2,170 | $37,610 |
| 2019 | $1,740 | $35,660 | $2,070 | $33,590 |
| 2018 | $1,702 | $35,660 | $2,070 | $33,590 |
| 2017 | $1,375 | $35,660 | $2,070 | $33,590 |
| 2016 | $1,063 | $23,800 | $1,980 | $21,820 |
| 2015 | $833 | $19,580 | $1,980 | $17,600 |
| 2014 | $857 | $19,580 | $1,980 | $17,600 |
| 2013 | $948 | $20,620 | $1,980 | $18,640 |
Source: Public Records
Map
Nearby Homes
- 211 S Main St
- 210 N Gilbert St
- 128 W North Ave
- 118 W Buckeye Ave
- 211 W Buckeye Ave Unit 211 1/2
- 442 Edwards St
- 444 Edwards St Unit A, B
- 444 Edwards St Unit 2
- 629 N Main St
- 212 N Simon St
- 301 S Main St
- 308-310 S Simon St
- 314 E University Ave
- 613 S Gilbert St
- 617 S Gilbert St
- 623 S Gilbert St
- 710 S Main St
- 4071 Township Road 35
- 2864 Ohio 309
- 3931 County Road 80
- 409 N Main St Unit 409 1/2
- 412 N Main St
- 416 N Main St
- 415 N Main St
- 405 N Main St
- 406 N Main St
- 421 N Main St Unit 421 1/2
- 420 N Main St
- 422 N Main St
- 425 N Main St
- 428 N Main St
- 402 N Main St
- 429 N Main St
- 118 W Montford Ave
- 319 N Main St
- 433 N Main St Unit 433 1/2
- 122 W Montford Ave
- 118 E Montford Ave