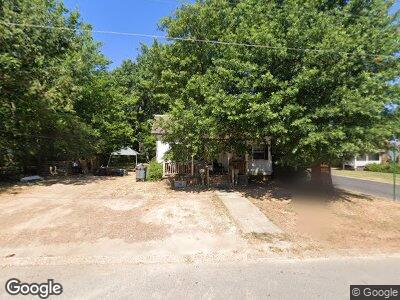
411 N Sowell St Searcy, AR 72143
Estimated Value: $70,317 - $104,000
--
Bed
1
Bath
912
Sq Ft
$98/Sq Ft
Est. Value
About This Home
This home is located at 411 N Sowell St, Searcy, AR 72143 and is currently estimated at $89,079, approximately $97 per square foot. 411 N Sowell St is a home located in White County with nearby schools including Southwest Middle School, McRae Elementary School, and Ahlf Junior High School.
Ownership History
Date
Name
Owned For
Owner Type
Purchase Details
Closed on
Nov 28, 2016
Sold by
Brissey Laura
Bought by
First Community Bank
Current Estimated Value
Purchase Details
Closed on
Mar 30, 1998
Bought by
Riley Elton E and Riley Wanda R
Purchase Details
Closed on
Sep 30, 1997
Bought by
Riley Elton E and Riley Wanda R
Purchase Details
Closed on
Aug 29, 1997
Bought by
Qualls Bobby R and Qualls Faye L
Purchase Details
Closed on
Sep 1, 1984
Bought by
Moss Donald R and Bobb Patsy A %
Create a Home Valuation Report for This Property
The Home Valuation Report is an in-depth analysis detailing your home's value as well as a comparison with similar homes in the area
Home Values in the Area
Average Home Value in this Area
Purchase History
| Date | Buyer | Sale Price | Title Company |
|---|---|---|---|
| Riley Elton E | -- | -- | |
| Riley Elton E | $17,000 | -- | |
| Qualls Bobby R | $15,000 | -- | |
| Moss Donald R | -- | -- |
Source: Public Records
Mortgage History
| Date | Status | Borrower | Loan Amount |
|---|---|---|---|
| Open | Brock Channing | $93,877 |
Source: Public Records
Tax History Compared to Growth
Tax History
| Year | Tax Paid | Tax Assessment Tax Assessment Total Assessment is a certain percentage of the fair market value that is determined by local assessors to be the total taxable value of land and additions on the property. | Land | Improvement |
|---|---|---|---|---|
| 2024 | $254 | $6,260 | $1,400 | $4,860 |
| 2023 | $254 | $6,260 | $1,400 | $4,860 |
| 2022 | $240 | $6,260 | $1,400 | $4,860 |
| 2021 | $220 | $6,260 | $1,400 | $4,860 |
| 2020 | $201 | $4,940 | $1,100 | $3,840 |
| 2019 | $201 | $4,940 | $1,100 | $3,840 |
| 2018 | $201 | $4,940 | $1,100 | $3,840 |
| 2017 | $201 | $4,940 | $1,100 | $3,840 |
| 2016 | $201 | $4,940 | $1,100 | $3,840 |
| 2015 | $247 | $6,090 | $2,100 | $3,990 |
| 2014 | $247 | $6,090 | $2,100 | $3,990 |
Source: Public Records
Map
Nearby Homes