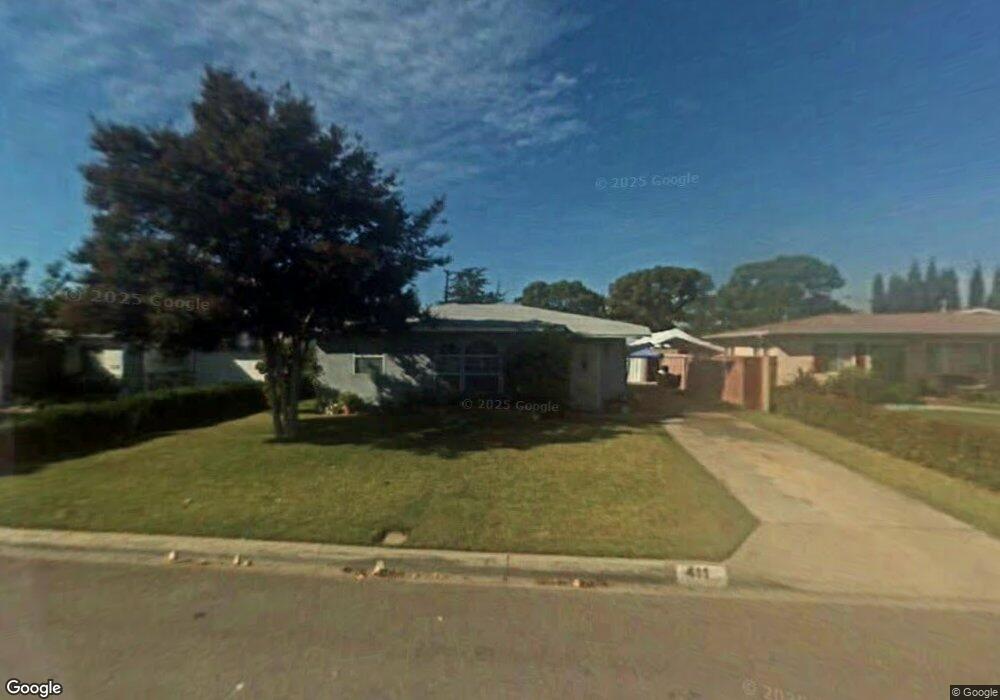
411 N Walnuthaven Dr West Covina, CA 91790
Estimated Value: $727,318 - $821,000
3
Beds
2
Baths
--
Sq Ft
8,146
Sq Ft Lot
About This Home
This home is located at 411 N Walnuthaven Dr, West Covina, CA 91790 and is currently estimated at $767,330. 411 N Walnuthaven Dr is a home located in Los Angeles County with nearby schools including Rowland Avenue Elementary School, Traweek Middle School, and Covina High School.
Ownership History
Date
Name
Owned For
Owner Type
Purchase Details
Closed on
Aug 7, 2008
Sold by
Garcia Dolores and Oliva Dolores
Bought by
Garcia Dolores
Current Estimated Value
Home Financials for this Owner
Home Financials are based on the most recent Mortgage that was taken out on this home.
Original Mortgage
$240,000
Outstanding Balance
$157,441
Interest Rate
6.32%
Mortgage Type
New Conventional
Estimated Equity
$609,889
Purchase Details
Closed on
Jan 17, 2003
Sold by
Garcia Anthony R
Bought by
Oliva Dolores
Home Financials for this Owner
Home Financials are based on the most recent Mortgage that was taken out on this home.
Original Mortgage
$160,650
Interest Rate
6.24%
Purchase Details
Closed on
Oct 21, 1993
Sold by
Fields Alan L and Fields Debra L
Bought by
Oliva Dolores
Home Financials for this Owner
Home Financials are based on the most recent Mortgage that was taken out on this home.
Original Mortgage
$139,400
Interest Rate
6.89%
Create a Home Valuation Report for This Property
The Home Valuation Report is an in-depth analysis detailing your home's value as well as a comparison with similar homes in the area
Home Values in the Area
Average Home Value in this Area
Purchase History
| Date | Buyer | Sale Price | Title Company |
|---|---|---|---|
| Garcia Dolores | -- | Stewart Title Of California | |
| Garcia Dolores | -- | Stewart Title Of California | |
| Oliva Dolores | -- | Ticor | |
| Oliva Dolores | $155,000 | Gateway Title |
Source: Public Records
Mortgage History
| Date | Status | Borrower | Loan Amount |
|---|---|---|---|
| Open | Garcia Dolores | $240,000 | |
| Closed | Garcia Dolores | $240,000 | |
| Closed | Oliva Dolores | $160,650 | |
| Previous Owner | Oliva Dolores | $139,400 |
Source: Public Records
Tax History Compared to Growth
Tax History
| Year | Tax Paid | Tax Assessment Tax Assessment Total Assessment is a certain percentage of the fair market value that is determined by local assessors to be the total taxable value of land and additions on the property. | Land | Improvement |
|---|---|---|---|---|
| 2025 | $3,472 | $263,249 | $152,108 | $111,141 |
| 2024 | $3,472 | $258,088 | $149,126 | $108,962 |
| 2023 | $3,420 | $253,028 | $146,202 | $106,826 |
| 2022 | $3,373 | $248,068 | $143,336 | $104,732 |
| 2021 | $3,320 | $243,205 | $140,526 | $102,679 |
| 2019 | $3,235 | $235,994 | $136,359 | $99,635 |
| 2018 | $3,040 | $231,368 | $133,686 | $97,682 |
| 2016 | $2,853 | $222,386 | $128,496 | $93,890 |
| 2015 | $2,784 | $219,046 | $126,566 | $92,480 |
| 2014 | $2,752 | $214,756 | $124,087 | $90,669 |
Source: Public Records
Map
Nearby Homes
- 427 N Walnuthaven Dr
- 557 N Broadmoor Ave
- 1319 W Eckerman Ave
- 1005 W Greendale St
- 537 N Yaleton Ave
- 218 Lockhart Way
- 104 Poxon Place
- 120 Poxon Place
- 750 N Sunset Ave
- 154 N Roberto Ave
- 1553 Dennis Place
- 410 N Lyall Ave
- 338 N Lyall Ave
- 16319 E Elgenia St
- 434 N Orange Ave
- 1037 E Grovecenter St
- 1908 W Thelborn St
- 1814 Seattle St
- 631 N La Sena Ave
- 4221 N Hartley Ave
- 407 N Walnuthaven Dr
- 417 N Walnuthaven Dr
- 417 N Walnuthaven Dr
- 403 N Walnuthaven Dr
- 423 N Walnuthaven Dr
- 412 N Broadmoor Ave
- 416 N Broadmoor Ave
- 408 N Broadmoor Ave
- 420 N Broadmoor Ave
- 402 N Broadmoor Ave
- 355 N Walnuthaven Dr
- 410 N Walnuthaven Dr
- 416 N Walnuthaven Dr
- 406 N Walnuthaven Dr
- 420 N Walnuthaven Dr
- 356 N Broadmoor Ave
- 426 N Broadmoor Ave
- 422 N Walnuthaven Dr
- 402 N Walnuthaven Dr
- 431 N Walnuthaven Dr