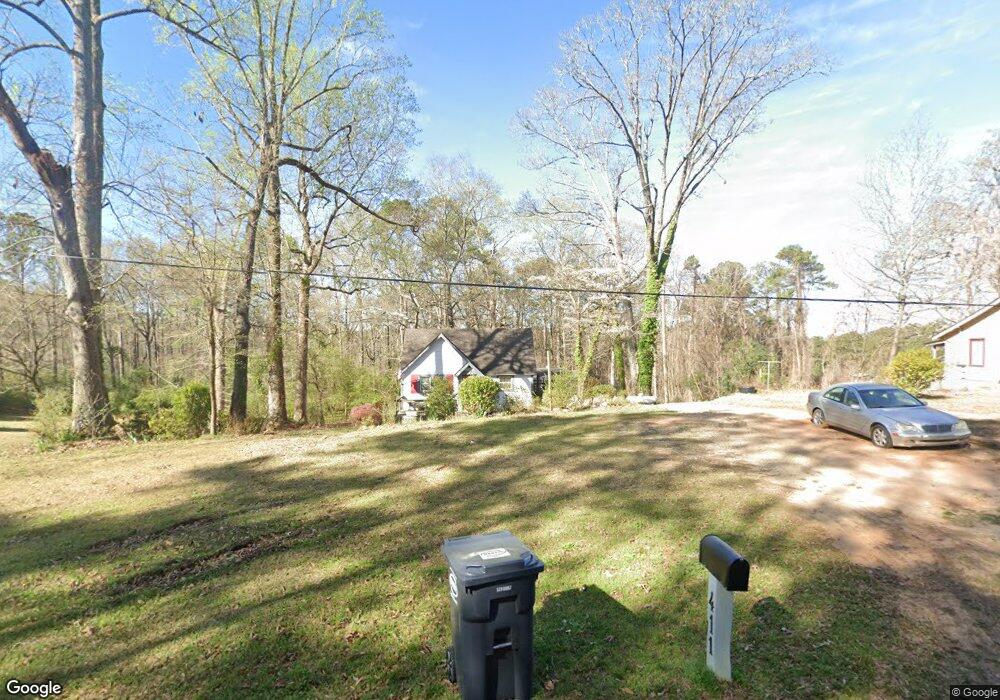
411 Old Roanoke Rd Lagrange, GA 30240
Estimated Value: $125,000 - $142,000
3
Beds
1
Bath
1,356
Sq Ft
$97/Sq Ft
Est. Value
About This Home
This home is located at 411 Old Roanoke Rd, Lagrange, GA 30240 and is currently estimated at $131,477, approximately $96 per square foot. 411 Old Roanoke Rd is a home located in Troup County with nearby schools including Ethel W. Kight Elementary School, Hollis Hand Elementary School, and Franklin Forest Elementary School.
Ownership History
Date
Name
Owned For
Owner Type
Purchase Details
Closed on
Nov 30, 2012
Sold by
Vinson Dana Brooke
Bought by
Pittman Marshall Clark and Pittman Pamela R
Current Estimated Value
Purchase Details
Closed on
Jun 3, 2008
Sold by
Avelo Mtg Llc
Bought by
Vinson Dana Brooke
Home Financials for this Owner
Home Financials are based on the most recent Mortgage that was taken out on this home.
Original Mortgage
$37,825
Interest Rate
6.04%
Mortgage Type
New Conventional
Purchase Details
Closed on
Feb 5, 2008
Sold by
Avelo Mtg Llc
Bought by
Avelo Mtg Llc
Purchase Details
Closed on
Nov 7, 2005
Sold by
Dukes Charles D
Bought by
Spielmann V Axel
Purchase Details
Closed on
Oct 12, 1995
Sold by
Hale T J
Bought by
Charles Charles D and Charles Edward L
Purchase Details
Closed on
Jun 7, 1963
Sold by
Hale Ike
Bought by
Hale T J
Create a Home Valuation Report for This Property
The Home Valuation Report is an in-depth analysis detailing your home's value as well as a comparison with similar homes in the area
Home Values in the Area
Average Home Value in this Area
Purchase History
| Date | Buyer | Sale Price | Title Company |
|---|---|---|---|
| Pittman Marshall Clark | $38,000 | -- | |
| Vinson Dana Brooke | $44,500 | -- | |
| Avelo Mtg Llc | $106,371 | -- | |
| Spielmann V Axel | $48,000 | -- | |
| Charles Charles D | $33,500 | -- | |
| Hale T J | -- | -- |
Source: Public Records
Mortgage History
| Date | Status | Borrower | Loan Amount |
|---|---|---|---|
| Previous Owner | Vinson Dana Brooke | $37,825 |
Source: Public Records
Tax History Compared to Growth
Tax History
| Year | Tax Paid | Tax Assessment Tax Assessment Total Assessment is a certain percentage of the fair market value that is determined by local assessors to be the total taxable value of land and additions on the property. | Land | Improvement |
|---|---|---|---|---|
| 2024 | $212 | $25,320 | $5,000 | $20,320 |
| 2023 | $3 | $21,160 | $5,000 | $16,160 |
| 2022 | $512 | $20,320 | $5,000 | $15,320 |
| 2021 | $489 | $18,200 | $3,600 | $14,600 |
| 2020 | $489 | $18,200 | $3,600 | $14,600 |
| 2019 | $479 | $17,880 | $3,600 | $14,280 |
| 2018 | $441 | $16,600 | $3,600 | $13,000 |
| 2017 | $441 | $16,600 | $3,600 | $13,000 |
| 2016 | $427 | $16,155 | $3,600 | $12,555 |
| 2015 | $435 | $16,366 | $3,600 | $12,766 |
| 2014 | $415 | $15,694 | $3,600 | $12,094 |
| 2013 | -- | $16,627 | $3,600 | $13,027 |
Source: Public Records
Map
Nearby Homes
- E Angela Dr
- 150 N Lake Dr
- LOT 4 Angela Dr
- 3010 White Oak Ct
- 4004 White Oak Ln
- 200 Cheyenne Dr
- 709 Vernon Ferry Rd
- 208 Highland Trail
- 0 Deming St Unit 10550189
- 207 Lakeshore Way
- 103 Dogwood Ct
- 104 Dogwood Point
- 104 Spring Valley Dr
- 205 Linda Ln
- 226 Linda Ln
- 117 Brookwood Dr
- 146 Whitaker Rd
- 223 Pinehaven Dr
- 135 Planters Ridge Dr
- 0 Cameron Mill Rd Unit 10640133
- 423 Old Roanoke Rd
- 393 Old Roanoke Rd
- 381 Old Roanoke Rd
- 381 Old Roanoke Rd
- 381 Old Roanoke Rd
- 431 Old Roanoke Rd
- 431 Old Roanoke Rd Unit 3AC
- 406 Old Roanoke Rd
- 188 Shirey Rd
- 416 Old Roanoke Rd
- 440 Old Roanoke Rd
- 119 Shirey Rd
- 167 Shirey Rd
- 353 Old Roanoke Rd
- 72 Shirey Rd
- 152 Shirey Rd
- 138 Shirey Rd
- 509 Old Roanoke Rd
- 7 AC Keel Cove Rd
- TRACT 1 Keel Cove Rd