411 S Main St West Unity, OH 43570
Estimated Value: $197,000 - $232,000
3
Beds
3
Baths
1,595
Sq Ft
$134/Sq Ft
Est. Value
About This Home
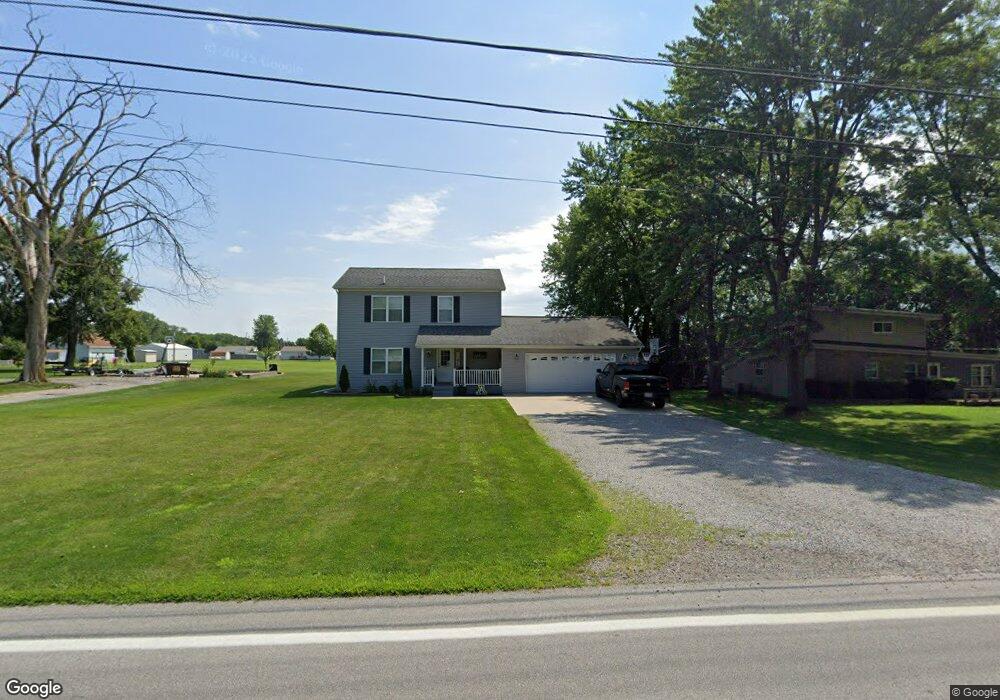
This home is located at 411 S Main St, West Unity, OH 43570 and is currently estimated at $214,489, approximately $134 per square foot. 411 S Main St is a home located in Williams County with nearby schools including Hilltop Elementary School and Hilltop High School.
Ownership History
Date
Name
Owned For
Owner Type
Purchase Details
Closed on
Aug 7, 2008
Sold by
Gray Kevin L and Gray Kellie J
Bought by
Brenner Derek S and Brenner Kasey L
Current Estimated Value
Home Financials for this Owner
Home Financials are based on the most recent Mortgage that was taken out on this home.
Original Mortgage
$119,253
Outstanding Balance
$78,614
Interest Rate
6.42%
Mortgage Type
FHA
Estimated Equity
$135,875
Purchase Details
Closed on
Feb 23, 2001
Bought by
Corman David E and Corman Laura
Purchase Details
Closed on
Nov 10, 1998
Sold by
Corman Westfall C and Corman David E O
Bought by
Westfall Trust C/O Corman David E & Laur
Purchase Details
Closed on
Oct 11, 1996
Sold by
Klopfenstein Victor
Bought by
Westfall Benny G and Westfall Janice M
Purchase Details
Closed on
Jan 1, 1990
Bought by
Klopfenstein Victor
Create a Home Valuation Report for This Property
The Home Valuation Report is an in-depth analysis detailing your home's value as well as a comparison with similar homes in the area
Purchase History
| Date | Buyer | Sale Price | Title Company |
|---|---|---|---|
| Brenner Derek S | $119,900 | None Available | |
| Corman David E | $10,000 | -- | |
| Westfall Trust C/O Corman David E & Laur | -- | -- | |
| Westfall Benny G | $75,000 | -- | |
| Klopfenstein Victor | -- | -- |
Source: Public Records
Mortgage History
| Date | Status | Borrower | Loan Amount |
|---|---|---|---|
| Open | Brenner Derek S | $119,253 |
Source: Public Records
Tax History
| Year | Tax Paid | Tax Assessment Tax Assessment Total Assessment is a certain percentage of the fair market value that is determined by local assessors to be the total taxable value of land and additions on the property. | Land | Improvement |
|---|---|---|---|---|
| 2025 | $2,540 | $64,650 | $5,710 | $58,940 |
| 2024 | $2,540 | $64,650 | $5,710 | $58,940 |
| 2023 | $2,584 | $52,330 | $5,710 | $46,620 |
| 2022 | $2,487 | $52,330 | $5,710 | $46,620 |
| 2021 | $2,486 | $52,330 | $5,710 | $46,620 |
| 2020 | $2,239 | $45,500 | $4,970 | $40,530 |
| 2019 | $2,204 | $45,500 | $4,970 | $40,530 |
| 2018 | $2,035 | $45,500 | $4,970 | $40,530 |
| 2017 | $1,966 | $40,220 | $4,730 | $35,490 |
| 2016 | $1,841 | $39,420 | $4,730 | $34,690 |
| 2015 | $2,094 | $39,420 | $4,730 | $34,690 |
| 2014 | $2,094 | $41,480 | $4,970 | $36,510 |
| 2013 | $2,071 | $41,480 | $4,970 | $36,510 |
Source: Public Records
Map
Nearby Homes
- 000 W Jackson
- 611 W Jackson St
- 613 W Jackson St
- 902 E Church St
- 502 N Lincoln St
- 22227 Us Highway 20a
- 9019 19-50 Rd
- 8437 18 Rd
- 8520 County Road 16
- 8520 Williams County Road 16
- 301 Horton St
- 303 E Curtis St
- 200 Tyler Ln
- 302 Tyler Ln
- 14640 U S 20a
- 16299 County Road F75
- 10918 Ohio 15
- 0 St Rt 15 Unit 10001011
- 0 US Highway 20a
- 433 Primrose Ln
Your Personal Tour Guide
Ask me questions while you tour the home.