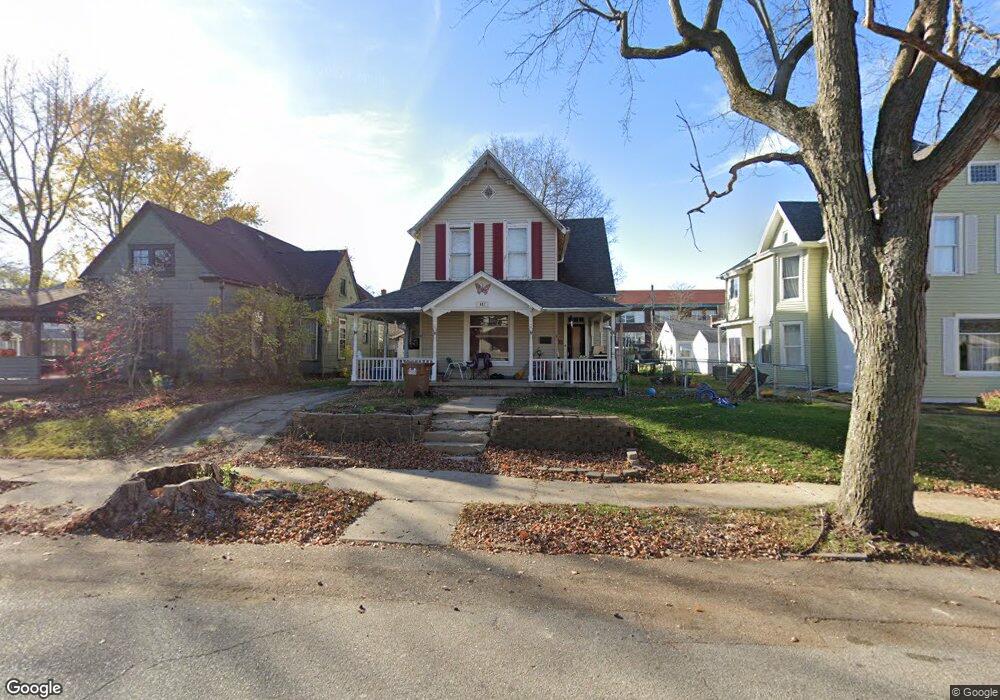
411 S Water St Crawfordsville, IN 47933
Estimated Value: $180,000 - $231,000
3
Beds
2
Baths
2,008
Sq Ft
$107/Sq Ft
Est. Value
About This Home
This home is located at 411 S Water St, Crawfordsville, IN 47933 and is currently estimated at $215,575, approximately $107 per square foot. 411 S Water St is a home located in Montgomery County with nearby schools including Mollie B. Hoover Elementary School, Laura Hose Elementary School, and Meredith Nicholson Elementary School.
Ownership History
Date
Name
Owned For
Owner Type
Purchase Details
Closed on
Dec 27, 2017
Sold by
Larsh Steven S
Bought by
Larsh Creston T and Larsh Kayla
Current Estimated Value
Purchase Details
Closed on
Nov 22, 2016
Sold by
Jpmorgan Chase Bank Na
Bought by
Larsh Steven S
Purchase Details
Closed on
Aug 10, 2016
Sold by
Evans Mark D and Evans Brandi M
Bought by
Jpmorgan Chase Bank Na
Purchase Details
Closed on
Jan 12, 2013
Sold by
Veach Scott M and Veach Amy J
Bought by
Evans Mark D and Evans Brandi M
Purchase Details
Closed on
Jul 31, 2007
Sold by
Evans Mark D
Bought by
Evans Mark D and Evans Brandi M
Home Financials for this Owner
Home Financials are based on the most recent Mortgage that was taken out on this home.
Original Mortgage
$109,800
Interest Rate
6.73%
Mortgage Type
New Conventional
Create a Home Valuation Report for This Property
The Home Valuation Report is an in-depth analysis detailing your home's value as well as a comparison with similar homes in the area
Home Values in the Area
Average Home Value in this Area
Purchase History
| Date | Buyer | Sale Price | Title Company |
|---|---|---|---|
| Larsh Creston T | -- | None Available | |
| Larsh Steven S | $48,010 | None Available | |
| Jpmorgan Chase Bank Na | $63,000 | None Available | |
| Evans Mark D | -- | None Available | |
| Evans Mark D | -- | American Integrity Title Inc |
Source: Public Records
Mortgage History
| Date | Status | Borrower | Loan Amount |
|---|---|---|---|
| Previous Owner | Evans Mark D | $109,800 |
Source: Public Records
Tax History Compared to Growth
Tax History
| Year | Tax Paid | Tax Assessment Tax Assessment Total Assessment is a certain percentage of the fair market value that is determined by local assessors to be the total taxable value of land and additions on the property. | Land | Improvement |
|---|---|---|---|---|
| 2024 | $4,893 | $195,400 | $23,100 | $172,300 |
| 2023 | $2,231 | $181,300 | $22,200 | $159,100 |
| 2022 | $2,370 | $190,900 | $22,200 | $168,700 |
| 2021 | $2,012 | $158,800 | $22,200 | $136,600 |
| 2020 | $1,965 | $154,900 | $22,200 | $132,700 |
| 2019 | $1,806 | $142,000 | $22,200 | $119,800 |
| 2018 | $3,339 | $140,400 | $17,600 | $122,800 |
| 2017 | $3,122 | $130,700 | $17,600 | $113,100 |
| 2016 | $2,974 | $124,900 | $17,600 | $107,300 |
| 2014 | $439 | $112,500 | $17,600 | $94,900 |
| 2013 | $439 | $107,000 | $17,600 | $89,400 |
Source: Public Records
Map
Nearby Homes
- 515 S Water St
- 304 E Franklin St
- 313 E Wabash Ave
- 408 E Wabash Ave
- 510 E Chestnut St
- 605 Tuttle Ave
- 521 E Main St
- 510 E Main St
- 706.5 John St
- 210 Wilhoit St
- 812 E College St
- 110 Woodlawn Place
- 706 Mill St
- 1107 Danville Ave
- TBD US Highway 136
- 411 Vandalia Ct
- 408 Hughes St
- 211 Vance St
- 717 W Wabash Ave
- 904 Cottage Ave
- 409 S Water St
- 410 Seminary St
- 408 Seminary St
- 412 Seminary St
- 407 S Water St
- 406 Seminary St
- 405 S Water St
- 412 S Water St
- 410 S Water St
- 404 Seminary St
- 213 E College St
- 403 S Water St
- 301 E College St
- 219 E College St
- 215 E College St
- 406 S Water St
- 402 Seminary St
- 306 E College St
- 303 E College St
- 211 E College St