Estimated Value: $427,000 - $525,000
2
Beds
1
Bath
967
Sq Ft
$486/Sq Ft
Est. Value
About This Home
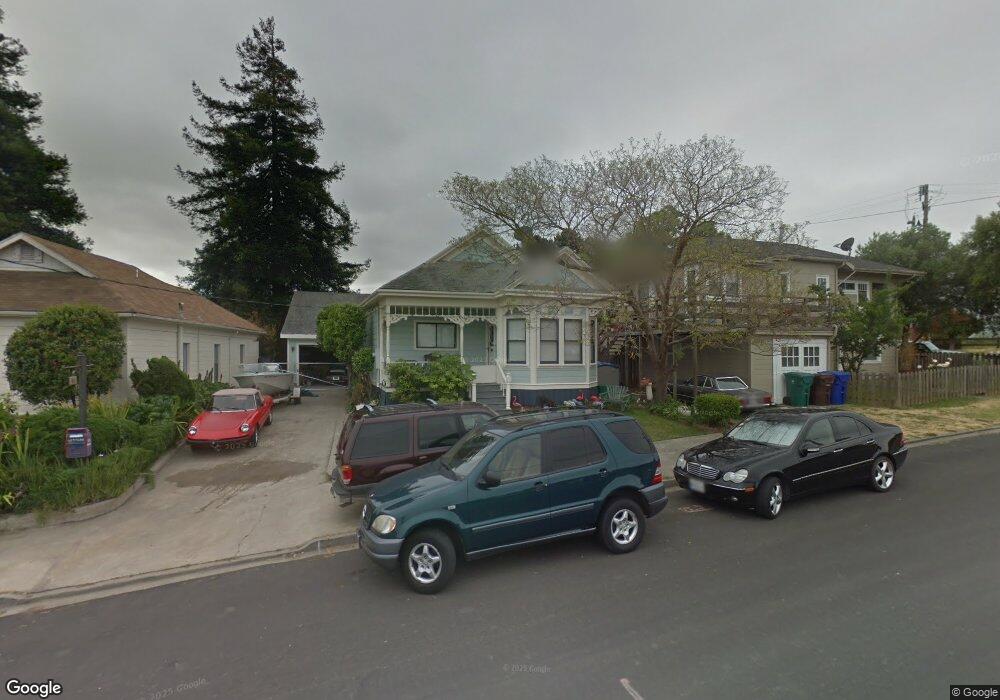
This home is located at 411 San Pablo Ave, Rodeo, CA 94572 and is currently estimated at $470,345, approximately $486 per square foot. 411 San Pablo Ave is a home located in Contra Costa County with nearby schools including Rodeo Hills Elementary School, Carquinez Middle School, and John Swett High School.
Ownership History
Date
Name
Owned For
Owner Type
Purchase Details
Closed on
Jan 18, 2023
Sold by
Thwaytes Cynthia
Bought by
Cynthia B Thwaytes Revocable Living Trust and Thwaytes
Current Estimated Value
Purchase Details
Closed on
Jan 20, 1998
Sold by
Marrinan Terrance A
Bought by
Thwaytes Cynthia
Home Financials for this Owner
Home Financials are based on the most recent Mortgage that was taken out on this home.
Original Mortgage
$123,450
Interest Rate
7.13%
Mortgage Type
Purchase Money Mortgage
Create a Home Valuation Report for This Property
The Home Valuation Report is an in-depth analysis detailing your home's value as well as a comparison with similar homes in the area
Home Values in the Area
Average Home Value in this Area
Purchase History
| Date | Buyer | Sale Price | Title Company |
|---|---|---|---|
| Cynthia B Thwaytes Revocable Living Trust | -- | None Listed On Document | |
| Thwaytes Cynthia | $130,000 | North American Title Co |
Source: Public Records
Mortgage History
| Date | Status | Borrower | Loan Amount |
|---|---|---|---|
| Previous Owner | Thwaytes Cynthia | $123,450 |
Source: Public Records
Tax History Compared to Growth
Tax History
| Year | Tax Paid | Tax Assessment Tax Assessment Total Assessment is a certain percentage of the fair market value that is determined by local assessors to be the total taxable value of land and additions on the property. | Land | Improvement |
|---|---|---|---|---|
| 2025 | $3,975 | $207,387 | $87,807 | $119,580 |
| 2024 | $3,890 | $203,322 | $86,086 | $117,236 |
| 2023 | $3,890 | $199,337 | $84,399 | $114,938 |
| 2022 | $3,751 | $195,430 | $82,745 | $112,685 |
| 2021 | $3,688 | $191,599 | $81,123 | $110,476 |
| 2019 | $3,598 | $185,918 | $78,718 | $107,200 |
| 2018 | $3,513 | $182,274 | $77,175 | $105,099 |
| 2017 | $3,450 | $178,701 | $75,662 | $103,039 |
| 2016 | $3,161 | $175,198 | $74,179 | $101,019 |
| 2015 | $3,137 | $172,567 | $73,065 | $99,502 |
| 2014 | $2,848 | $148,500 | $62,875 | $85,625 |
Source: Public Records
Map
Nearby Homes