
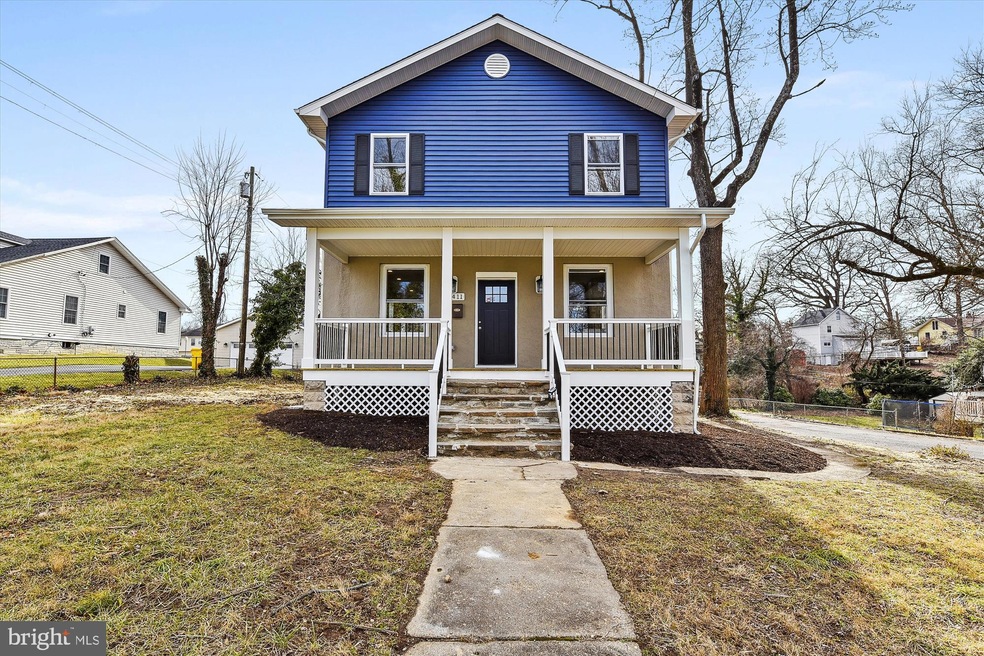
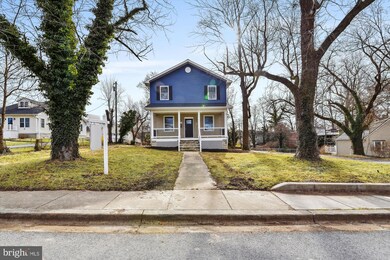
411 W Maple Rd Linthicum Heights, MD 21090
4
Beds
2.5
Baths
2,615
Sq Ft
0.41
Acres
Highlights
- Remodeled in 2022
- Craftsman Architecture
- No HOA
- 0.41 Acre Lot
- Deck
- 1 Car Detached Garage
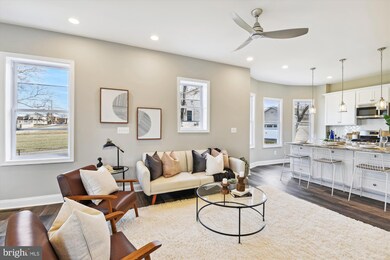
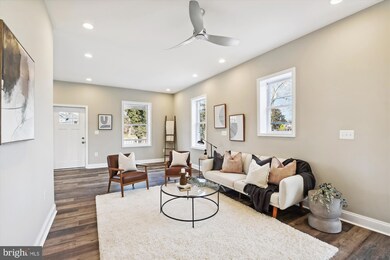
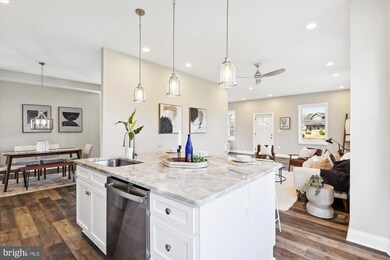
About This Home
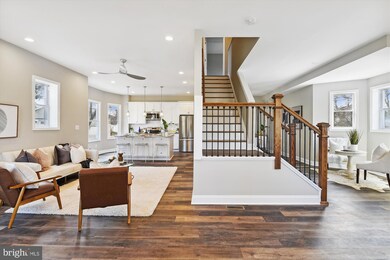
As of June 2023Big price reduction: Come check out this Beautiful Remodeled home in the heart of Linthicum Heights sitting on almost 1/2 acre lot. This Craftsman style home features 4 large bedrooms 2 and half baths, open first level floor plan with stately 9ft ceilings. Rare, large yard with ample room for parking and detached garage makes this home ideal from all family sizes. Convenient location with access to all major highways in the Baltimore Metropolitan area. A Must See!!
Home Details
Home Type
- Single Family
Est. Annual Taxes
- $3,609
Year Built
- Built in 1935 | Remodeled in 2022
Lot Details
- 0.41 Acre Lot
- Property is in excellent condition
- Property is zoned R5
Parking
- 1 Car Detached Garage
- Parking Storage or Cabinetry
- Front Facing Garage
- Garage Door Opener
- Driveway
Home Design
- Craftsman Architecture
- Block Foundation
- Stucco
Interior Spaces
- Property has 2 Levels
Bedrooms and Bathrooms
Unfinished Basement
- Connecting Stairway
- Interior and Exterior Basement Entry
Outdoor Features
- Deck
Utilities
- 90% Forced Air Heating and Cooling System
- Natural Gas Water Heater
Community Details
- No Home Owners Association
- Linthicum Heights Annex Subdivision
Listing and Financial Details
- Tax Lot 86
- Assessor Parcel Number 020548117384725
Ownership History
Date
Name
Owned For
Owner Type
Purchase Details
Listed on
May 22, 2022
Closed on
Jun 15, 2022
Sold by
Palmier Family Living Trust
Bought by
Mdc Investments Llc
Seller's Agent
Bob Chew
Samson Properties
Buyer's Agent
Joe Casey
Taylor Properties
List Price
$299,000
Sold Price
$257,500
Premium/Discount to List
-$41,500
-13.88%
Current Estimated Value
Home Financials for this Owner
Home Financials are based on the most recent Mortgage that was taken out on this home.
Estimated Appreciation
$316,038
Avg. Annual Appreciation
29.80%
Original Mortgage
$400,000
Outstanding Balance
$383,220
Interest Rate
5.25%
Mortgage Type
New Conventional
Estimated Equity
$190,318
Purchase Details
Closed on
Apr 27, 2020
Sold by
Palmieri Gary
Bought by
Palmier Family Living Trust
Purchase Details
Listed on
Oct 10, 2019
Closed on
Nov 22, 2019
Sold by
Smith Patricia A and Smith Patricia Ann
Bought by
Palmieri Gary
Seller's Agent
Stephanie Klemkowski
Berkshire Hathaway HomeServices PenFed Realty
Buyer's Agent
Donna Webb-Scott
Long & Foster Real Estate, Inc.
List Price
$199,999
Sold Price
$180,000
Premium/Discount to List
-$19,999
-10%
Home Financials for this Owner
Home Financials are based on the most recent Mortgage that was taken out on this home.
Avg. Annual Appreciation
22.81%
Purchase Details
Closed on
Oct 24, 1983
Bought by
Smith Glenn A and Smith Patricia A
Home Financials for this Owner
Home Financials are based on the most recent Mortgage that was taken out on this home.
Original Mortgage
$52,000
Interest Rate
13.52%
Similar Homes in Linthicum Heights, MD
Create a Home Valuation Report for This Property
The Home Valuation Report is an in-depth analysis detailing your home's value as well as a comparison with similar homes in the area
Home Values in the Area
Average Home Value in this Area
Purchase History
| Date | Type | Sale Price | Title Company |
|---|---|---|---|
| Deed | $275,500 | New Title Company Name | |
| Interfamily Deed Transfer | -- | None Available | |
| Deed | $180,000 | Goldstar Title Company | |
| Deed | $81,000 | -- |
Source: Public Records
Mortgage History
| Date | Status | Loan Amount | Loan Type |
|---|---|---|---|
| Open | $400,000 | New Conventional | |
| Previous Owner | $52,000 | No Value Available |
Source: Public Records
Property History
| Date | Event | Price | Change | Sq Ft Price |
|---|---|---|---|---|
| 06/23/2023 06/23/23 | Sold | $550,000 | -2.7% | $210 / Sq Ft |
| 05/17/2023 05/17/23 | Pending | -- | -- | -- |
| 05/11/2023 05/11/23 | Price Changed | $565,000 | -2.4% | $216 / Sq Ft |
| 04/27/2023 04/27/23 | Price Changed | $579,000 | -1.7% | $221 / Sq Ft |
| 04/04/2023 04/04/23 | Price Changed | $589,000 | -1.0% | $225 / Sq Ft |
| 02/24/2023 02/24/23 | Price Changed | $595,000 | -4.6% | $228 / Sq Ft |
| 02/13/2023 02/13/23 | Price Changed | $624,000 | -2.3% | $239 / Sq Ft |
| 01/26/2023 01/26/23 | For Sale | $639,000 | +148.2% | $244 / Sq Ft |
| 06/15/2022 06/15/22 | Sold | $257,500 | 0.0% | $132 / Sq Ft |
| 05/25/2022 05/25/22 | Pending | -- | -- | -- |
| 05/25/2022 05/25/22 | Off Market | $257,500 | -- | -- |
| 05/22/2022 05/22/22 | For Sale | $299,000 | +66.1% | $153 / Sq Ft |
| 11/22/2019 11/22/19 | Sold | $180,000 | -10.0% | $92 / Sq Ft |
| 10/30/2019 10/30/19 | Pending | -- | -- | -- |
| 10/10/2019 10/10/19 | For Sale | $199,999 | -- | $102 / Sq Ft |
Source: Bright MLS
Tax History Compared to Growth
Tax History
| Year | Tax Paid | Tax Assessment Tax Assessment Total Assessment is a certain percentage of the fair market value that is determined by local assessors to be the total taxable value of land and additions on the property. | Land | Improvement |
|---|---|---|---|---|
| 2024 | $6,920 | $586,067 | $0 | $0 |
| 2023 | $6,576 | $558,833 | $0 | $0 |
| 2022 | $3,726 | $315,400 | $181,500 | $133,900 |
| 2021 | $3,619 | $305,100 | $0 | $0 |
| 2020 | $3,471 | $294,800 | $0 | $0 |
| 2019 | $5,123 | $284,500 | $159,500 | $125,000 |
| 2018 | $2,792 | $275,367 | $0 | $0 |
| 2017 | $2,432 | $266,233 | $0 | $0 |
| 2016 | -- | $257,100 | $0 | $0 |
| 2015 | -- | $257,100 | $0 | $0 |
| 2014 | -- | $257,100 | $0 | $0 |
Source: Public Records
Agents Affiliated with this Home
-
Joe Casey
J
Seller's Agent in 2023
Joe Casey
Taylor Properties
(240) 354-2003
2 in this area
34 Total Sales
-
Mary Tablada
Buyer's Agent in 2023
Mary Tablada
RE/MAX
(443) 285-3682
1 in this area
55 Total Sales
-
Bob Chew
Seller's Agent in 2022
Bob Chew
Samson Properties
(410) 995-9600
24 in this area
2,759 Total Sales
-
Casey Franz
Seller Co-Listing Agent in 2022
Casey Franz
Cummings & Co. Realtors
(443) 996-0241
2 in this area
44 Total Sales
-
Stephanie Klemkowski
Seller's Agent in 2019
Stephanie Klemkowski
BHHS PenFed (actual)
(443) 869-0010
5 Total Sales
-
Donna Webb-Scott
Buyer's Agent in 2019
Donna Webb-Scott
Long & Foster
(410) 382-9440
4 in this area
15 Total Sales
Map
Source: Bright MLS
MLS Number: MDAA2049386
APN: 05-481-17384725
Disclaimer: Certain information contained herein is derived from information provided by parties other than Homes.com. All information provided is deemed reliable, but is not guaranteed to be accurate and should be independently verified.
![]() The data relating to real estate for sale on this website appears in part through the BRIGHT Internet Data Exchange program, a voluntary cooperative exchange of property listing data between licensed real estate brokerage firms, and is provided by BRIGHT through a licensing agreement.
The data relating to real estate for sale on this website appears in part through the BRIGHT Internet Data Exchange program, a voluntary cooperative exchange of property listing data between licensed real estate brokerage firms, and is provided by BRIGHT through a licensing agreement.
Listing information is from various brokers who participate in the Bright MLS IDX program and not all listings may be visible on the site.
The property information being provided on or through the website is for the personal, non-commercial use of consumers and such information may not be used for any purpose other than to identify prospective properties consumers may be interested in purchasing.
Some properties which appear for sale on the website may no longer be available because they are for instance, under contract, sold or are no longer being offered for sale.
Property information displayed is deemed reliable but is not guaranteed.
Copyright 2025 Bright MLS, Inc.
Nearby Homes
- 218 N Hammonds Ferry Rd
- 412 Shipley Rd
- 500 S Hammonds Ferry Rd
- 402 Forest View Rd
- 536 Forest View Rd
- 305 Darlene Ave
- 6214 Woodland Rd
- 0 Laurel Rd
- 5917 Linthicum Ln
- 435 Applegate Ct
- 331 E Maple Rd
- 611 North Ct
- 5900 Medora Rd
- 207 Viewing Ave
- 110 Laurel Ave
- 103 S Midfield Rd
- 709 Greentree Rd
- 210 Coronet Dr
- 105 Juniper Cir
- 6424 Saint Phillips Rd