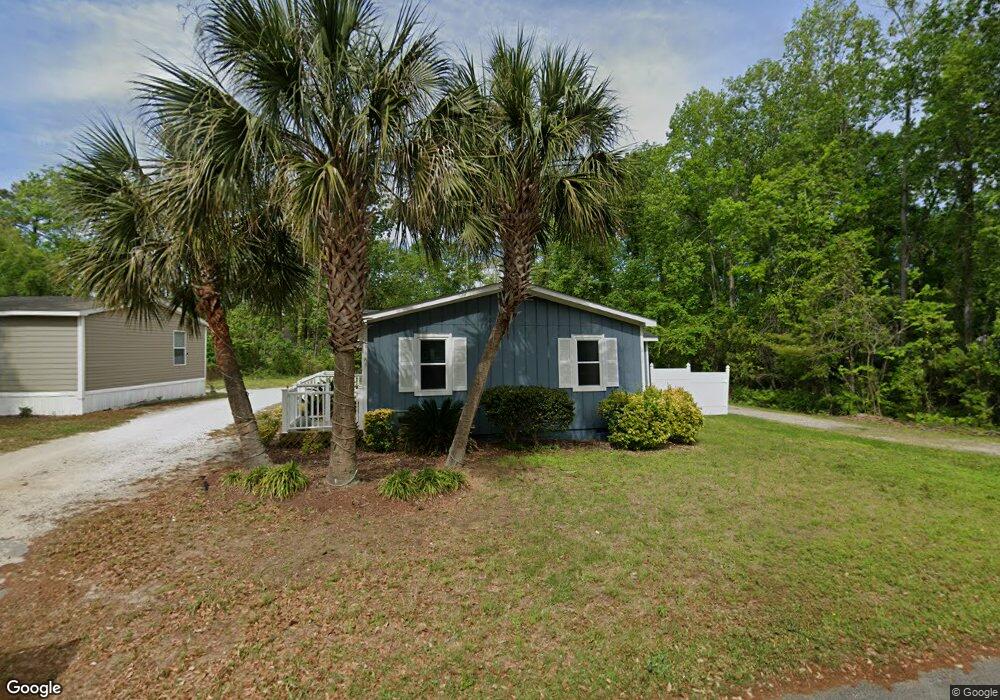
411 Wando St Murrells Inlet, SC 29576
Estimated Value: $329,000 - $486,057
3
Beds
1
Bath
1,200
Sq Ft
$365/Sq Ft
Est. Value
About This Home
This home is located at 411 Wando St, Murrells Inlet, SC 29576 and is currently estimated at $438,014, approximately $365 per square foot. 411 Wando St is a home located in Horry County with nearby schools including Seaside Elementary, St. James Middle School, and St. James Intermediate.
Ownership History
Date
Name
Owned For
Owner Type
Purchase Details
Closed on
May 8, 2015
Sold by
Starnes Martin Adam Harrell and Starnes Martin Jana
Bought by
Young David B and Porier Young Dawn E
Current Estimated Value
Home Financials for this Owner
Home Financials are based on the most recent Mortgage that was taken out on this home.
Original Mortgage
$175,000
Outstanding Balance
$135,155
Interest Rate
3.75%
Mortgage Type
Future Advance Clause Open End Mortgage
Estimated Equity
$302,859
Purchase Details
Closed on
Apr 29, 2011
Sold by
Graham Evelyn A
Bought by
Starnes Jana Lee
Purchase Details
Closed on
May 12, 2003
Sold by
Moorefield Susan B
Bought by
Graham Larry W and Graham Evelyn A
Home Financials for this Owner
Home Financials are based on the most recent Mortgage that was taken out on this home.
Original Mortgage
$101,000
Interest Rate
5.81%
Mortgage Type
Purchase Money Mortgage
Purchase Details
Closed on
May 21, 1998
Sold by
Moorefield Tim C
Bought by
Moorefield Susan B
Create a Home Valuation Report for This Property
The Home Valuation Report is an in-depth analysis detailing your home's value as well as a comparison with similar homes in the area
Home Values in the Area
Average Home Value in this Area
Purchase History
| Date | Buyer | Sale Price | Title Company |
|---|---|---|---|
| Young David B | $220,000 | -- | |
| Starnes Jana Lee | $130,000 | -- | |
| Graham Larry W | $120,000 | -- | |
| Moorefield Susan B | $70,000 | -- |
Source: Public Records
Mortgage History
| Date | Status | Borrower | Loan Amount |
|---|---|---|---|
| Open | Young David B | $175,000 | |
| Previous Owner | Graham Larry W | $101,000 |
Source: Public Records
Tax History Compared to Growth
Tax History
| Year | Tax Paid | Tax Assessment Tax Assessment Total Assessment is a certain percentage of the fair market value that is determined by local assessors to be the total taxable value of land and additions on the property. | Land | Improvement |
|---|---|---|---|---|
| 2024 | $3,323 | $23,278 | $17,462 | $5,816 |
| 2023 | $0 | $13,711 | $6,997 | $6,714 |
| 2021 | $2,886 | $13,711 | $6,997 | $6,714 |
| 2020 | $2,766 | $13,711 | $6,997 | $6,714 |
| 2019 | $2,766 | $13,711 | $6,997 | $6,714 |
| 2018 | $2,595 | $12,410 | $9,356 | $3,054 |
| 2017 | $2,580 | $12,410 | $9,356 | $3,054 |
| 2016 | $0 | $12,410 | $9,356 | $3,054 |
| 2015 | -- | $7,910 | $4,856 | $3,054 |
| 2014 | $405 | $5,274 | $3,238 | $2,036 |
Source: Public Records
Map
Nearby Homes
- 390 Boundary Ave
- 513 1st St
- Lot 4 Seacrest Dr
- 520 & 526 Boundary Ave
- 1508 Sunnydale Ln
- 316 Cypress Ave
- 724 1st St
- 449 Delton Dr
- 425 Delton Dr
- 310 Clam Shell Cir
- 435 Delton Dr
- 315 Inlet Rd
- 326 Tunnoch Rd
- 324 Yucca Cir
- 399 Elizabeth Dr
- 495 Clubhouse Rd
- 322 Yucca Cir
- 527 Bay Drive Extension
- 382 W Canal
- 494 Clubhouse Rd