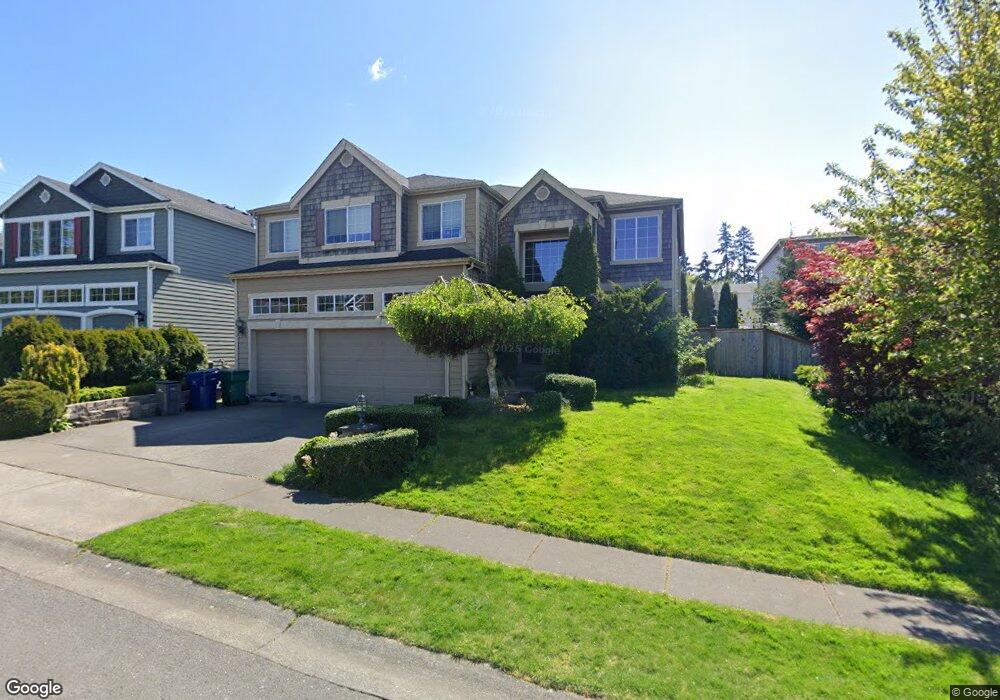
4110 220th St SE Bothell, WA 98021
Canyon Creek NeighborhoodEstimated Value: $1,364,343 - $1,495,000
4
Beds
3
Baths
3,005
Sq Ft
$484/Sq Ft
Est. Value
About This Home
This home is located at 4110 220th St SE, Bothell, WA 98021 and is currently estimated at $1,453,586, approximately $483 per square foot. 4110 220th St SE is a home located in Snohomish County with nearby schools including Kokanee Elementary School, Leota Middle School, and North Creek High School.
Ownership History
Date
Name
Owned For
Owner Type
Purchase Details
Closed on
Jun 17, 2010
Sold by
Jung Bok Yu and Jung Cathy
Bought by
Fernandes Sanjay and Fernandes Janet
Current Estimated Value
Home Financials for this Owner
Home Financials are based on the most recent Mortgage that was taken out on this home.
Original Mortgage
$393,600
Outstanding Balance
$257,896
Interest Rate
4.91%
Mortgage Type
New Conventional
Estimated Equity
$1,195,690
Purchase Details
Closed on
Jan 25, 2006
Sold by
Bennett Homes Inc
Bought by
Jung Cathy and Jung Bok Yu
Home Financials for this Owner
Home Financials are based on the most recent Mortgage that was taken out on this home.
Original Mortgage
$374,360
Interest Rate
5.5%
Mortgage Type
Fannie Mae Freddie Mac
Create a Home Valuation Report for This Property
The Home Valuation Report is an in-depth analysis detailing your home's value as well as a comparison with similar homes in the area
Home Values in the Area
Average Home Value in this Area
Purchase History
| Date | Buyer | Sale Price | Title Company |
|---|---|---|---|
| Fernandes Sanjay | $492,000 | Rainier Title | |
| Jung Cathy | $539,800 | First American Title Ins Co |
Source: Public Records
Mortgage History
| Date | Status | Borrower | Loan Amount |
|---|---|---|---|
| Open | Fernandes Sanjay | $393,600 | |
| Previous Owner | Jung Cathy | $374,360 |
Source: Public Records
Tax History
| Year | Tax Paid | Tax Assessment Tax Assessment Total Assessment is a certain percentage of the fair market value that is determined by local assessors to be the total taxable value of land and additions on the property. | Land | Improvement |
|---|---|---|---|---|
| 2026 | $10,373 | $1,311,100 | $855,000 | $456,100 |
| 2025 | $9,449 | $1,159,100 | $715,000 | $444,100 |
| 2024 | $9,449 | $1,055,700 | $627,000 | $428,700 |
| 2023 | $9,731 | $1,212,400 | $725,000 | $487,400 |
| 2022 | $9,239 | $915,900 | $440,000 | $475,900 |
| 2020 | $8,957 | $838,500 | $403,000 | $435,500 |
| 2019 | $8,160 | $772,900 | $320,000 | $452,900 |
| 2018 | $7,755 | $684,100 | $280,000 | $404,100 |
| 2017 | $6,739 | $605,000 | $225,000 | $380,000 |
| 2016 | $6,494 | $569,100 | $205,000 | $364,100 |
| 2015 | $6,545 | $545,200 | $191,000 | $354,200 |
| 2013 | $5,660 | $419,200 | $157,000 | $262,200 |
Source: Public Records
Map
Nearby Homes
- 4118 220th Place SE
- 4132 220th St SE
- 4216 220th St SE
- 4215 220th St SE
- 4219 220th St SE
- 4103 220th St SE
- 21903 41st Ave SE
- 3931 221st Place SE
- 4214 223rd Place SE
- 21927 44th Dr SE
- 21705 38th Dr SE
- 4026 215th Place SE
- 4426 216th Place SE
- 3626 222nd Place SE
- 4001 215th St SE Unit A
- 3928 214th Place SE Unit B
- 3918 214th Place SE Unit A
- 21417 43rd Dr SE Unit 19
- 4215 228th St SE
- 22222 49th Ave SE
- 4113 221st St SE
- 4120 220th St SE
- 4104 220th St SE
- 4113 221st St SE
- 4124 220th St SE
- 4107 220th St SE
- 4101 220th St SE
- 4028 220th St SE
- 21923 41st Ave SE
- 4207 221st St SE
- 4027 220th St SE
- 21928 42nd Ave SE
- 21933 42nd Ave SE
- 4117 221st Place SE
- 4123 221st Place SE
- 4118 220th St SE
- 21917 41st Ave SE
- 4022 220th St SE
- 4228 220th St SE
Your Personal Tour Guide
Ask me questions while you tour the home.