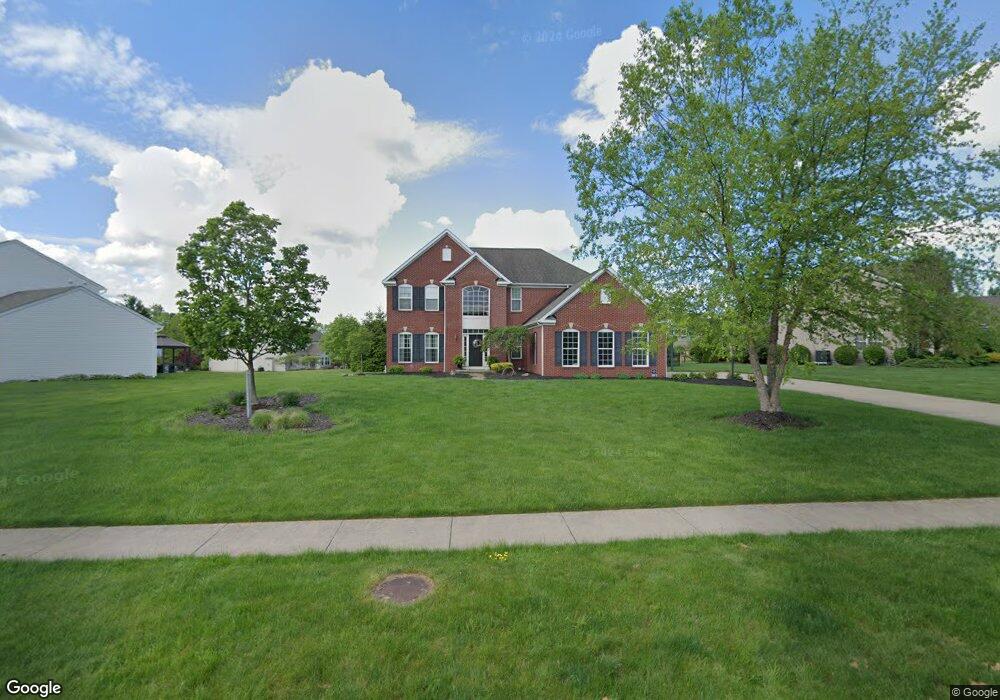
4111 Appleridge Ln Richfield, OH 44286
Estimated Value: $606,000 - $782,000
4
Beds
4
Baths
2,928
Sq Ft
$228/Sq Ft
Est. Value
About This Home
This home is located at 4111 Appleridge Ln, Richfield, OH 44286 and is currently estimated at $668,857, approximately $228 per square foot. 4111 Appleridge Ln is a home located in Summit County with nearby schools including Richfield Elementary School, Bath Elementary School, and Revere Middle School.
Ownership History
Date
Name
Owned For
Owner Type
Purchase Details
Closed on
Aug 23, 2018
Sold by
Eberhardt Gregory S and Eberhardt Kristi Z
Bought by
Eberhardt Gregory S and Eberhardt Kristi Z
Current Estimated Value
Home Financials for this Owner
Home Financials are based on the most recent Mortgage that was taken out on this home.
Original Mortgage
$308,125
Outstanding Balance
$267,594
Interest Rate
4.5%
Mortgage Type
New Conventional
Estimated Equity
$401,263
Purchase Details
Closed on
Feb 6, 2009
Sold by
Nvr Inc
Bought by
Eberhardt Gregory S and Eberhardt Kristi Z
Home Financials for this Owner
Home Financials are based on the most recent Mortgage that was taken out on this home.
Original Mortgage
$294,500
Interest Rate
5.06%
Mortgage Type
Purchase Money Mortgage
Purchase Details
Closed on
Dec 3, 2008
Sold by
Lifestyle Neighborhoods Co
Bought by
Nvr Inc and Ryan Homes
Create a Home Valuation Report for This Property
The Home Valuation Report is an in-depth analysis detailing your home's value as well as a comparison with similar homes in the area
Home Values in the Area
Average Home Value in this Area
Purchase History
| Date | Buyer | Sale Price | Title Company |
|---|---|---|---|
| Eberhardt Gregory S | -- | Land Title Group Llc | |
| Eberhardt Gregory S | $368,140 | Nvr Title Agency Llc | |
| Nvr Inc | $95,000 | Nvr Title Agency Llc |
Source: Public Records
Mortgage History
| Date | Status | Borrower | Loan Amount |
|---|---|---|---|
| Open | Eberhardt Gregory S | $308,125 | |
| Closed | Eberhardt Gregory S | $294,500 |
Source: Public Records
Tax History
| Year | Tax Paid | Tax Assessment Tax Assessment Total Assessment is a certain percentage of the fair market value that is determined by local assessors to be the total taxable value of land and additions on the property. | Land | Improvement |
|---|---|---|---|---|
| 2024 | $7,035 | $163,744 | $26,719 | $137,025 |
| 2023 | $7,035 | $163,744 | $26,719 | $137,025 |
| 2022 | $7,300 | $149,503 | $24,290 | $125,213 |
| 2021 | $7,305 | $149,503 | $24,290 | $125,213 |
| 2020 | $7,132 | $149,500 | $24,290 | $125,210 |
| 2019 | $7,111 | $139,740 | $23,560 | $116,180 |
| 2018 | $7,029 | $139,740 | $23,560 | $116,180 |
| 2017 | $5,668 | $139,740 | $23,560 | $116,180 |
| 2016 | $6,432 | $120,040 | $23,560 | $96,480 |
| 2015 | $5,668 | $110,910 | $23,560 | $87,350 |
| 2014 | $5,628 | $110,910 | $23,560 | $87,350 |
| 2013 | $5,655 | $116,920 | $23,560 | $93,360 |
Source: Public Records
Map
Nearby Homes
- 3582 W Glencoe Rd
- 2941 Southern Rd
- 3509 Patterson Cir
- 3814 Faith Ln Unit 1
- 3454 Skye Ridge Dr
- 3521 Hamilton Dr
- 3860 Sawbridge Dr Unit 21
- 3526 Crawford Dr
- V/L Brecksville Rd
- 3906 Everett Rd
- 2370 N Cleveland Massillon Rd
- 3797 Stewart Ct
- 3123 Aviemore Way
- 5179 W Streetsboro Rd
- 3621 Seven Oaks Trail
- 3175 W Streetsboro Rd
- 3487 Crandall Ave
- 3452 Crandall Ave
- 3478 Crandall Ave
- 2250 Candlewood Ln
- 4129 Appleridge Ln
- 4089 Appleridge Ln
- 4112 Appleridge Ln
- 4159 Appleridge Ln
- 4067 Appleridge Ln
- 4102 Appleridge Ln
- 4122 Appleridge Ln
- 4094 Appleridge Ln
- 4057 Appleridge Ln
- 4130 Appleridge Ln
- 4086 Appleridge Ln
- 4181 Appleridge Ln
- 4078 Appleridge Ln
- 4138 Appleridge Ln
- 4146 Appleridge Ln
- 4047 Appleridge Ln
- 4154 Appleridge Ln
- 4064 Appleridge Ln
- 4162 Appleridge Ln
- 4174 Appleridge Ln
Your Personal Tour Guide
Ask me questions while you tour the home.