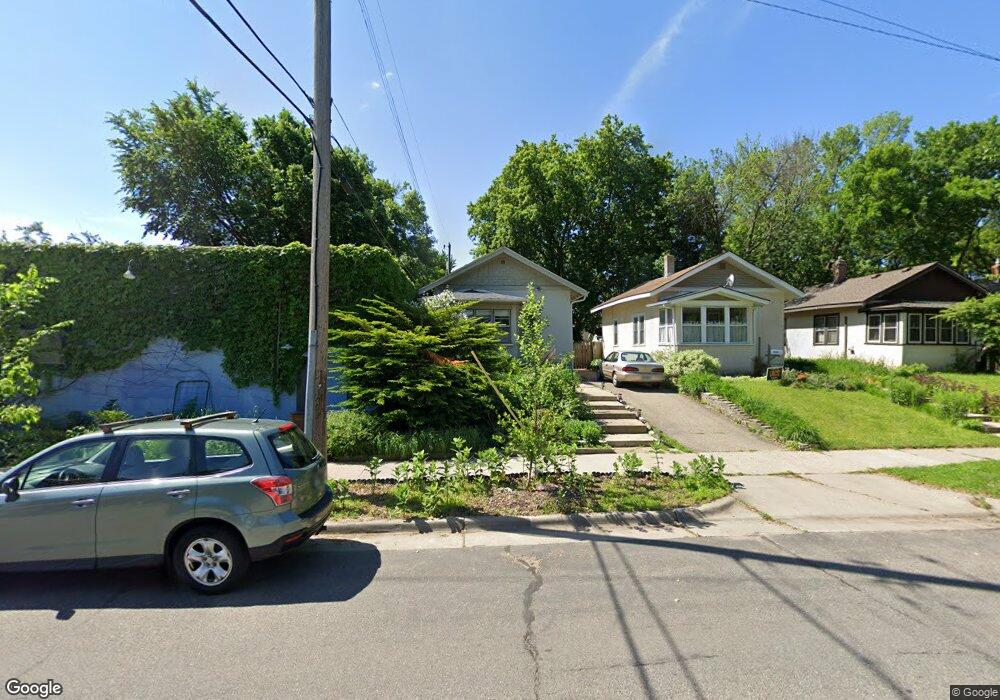
4111 E 34th St Minneapolis, MN 55406
Howe NeighborhoodEstimated Value: $245,097 - $268,000
1
Bed
1
Bath
600
Sq Ft
$423/Sq Ft
Est. Value
About This Home
This home is located at 4111 E 34th St, Minneapolis, MN 55406 and is currently estimated at $254,024, approximately $423 per square foot. 4111 E 34th St is a home located in Hennepin County with nearby schools including Howe Elementary School, Hiawatha Community School, and Sanford Middle School.
Ownership History
Date
Name
Owned For
Owner Type
Purchase Details
Closed on
Jul 30, 2021
Sold by
Paro Joshua A and Abend Laura L
Bought by
Vaughan Yuriko S
Current Estimated Value
Home Financials for this Owner
Home Financials are based on the most recent Mortgage that was taken out on this home.
Original Mortgage
$193,600
Outstanding Balance
$176,305
Interest Rate
3%
Mortgage Type
New Conventional
Estimated Equity
$77,719
Purchase Details
Closed on
May 18, 2018
Sold by
Beckstrom Lisa Ann
Bought by
Paro Joshua A and Abend Laura L
Home Financials for this Owner
Home Financials are based on the most recent Mortgage that was taken out on this home.
Original Mortgage
$87,000
Interest Rate
4.4%
Mortgage Type
New Conventional
Purchase Details
Closed on
Oct 21, 2015
Sold by
Beckstrom Lisa Ann
Bought by
Beckstrom Lisa Ann and Lisa Ann Beckstrom Trust
Purchase Details
Closed on
Dec 17, 2004
Sold by
Greiner Kent J
Bought by
Beckstrom Lisa A
Create a Home Valuation Report for This Property
The Home Valuation Report is an in-depth analysis detailing your home's value as well as a comparison with similar homes in the area
Home Values in the Area
Average Home Value in this Area
Purchase History
| Date | Buyer | Sale Price | Title Company |
|---|---|---|---|
| Vaughan Yuriko S | $242,000 | Knight Barry Title | |
| Paro Joshua A | $187,000 | Title One Inc | |
| Beckstrom Lisa Ann | -- | Attorney | |
| Beckstrom Lisa A | $154,400 | -- | |
| Vaughan Yuriko Yuriko | $242,000 | -- |
Source: Public Records
Mortgage History
| Date | Status | Borrower | Loan Amount |
|---|---|---|---|
| Open | Vaughan Yuriko S | $193,600 | |
| Previous Owner | Paro Joshua A | $87,000 | |
| Closed | Vaughan Yuriko Yuriko | $193,600 |
Source: Public Records
Tax History
| Year | Tax Paid | Tax Assessment Tax Assessment Total Assessment is a certain percentage of the fair market value that is determined by local assessors to be the total taxable value of land and additions on the property. | Land | Improvement |
|---|---|---|---|---|
| 2024 | $3,123 | $210,000 | $114,000 | $96,000 |
| 2023 | $2,872 | $220,000 | $114,000 | $106,000 |
| 2022 | $2,397 | $220,000 | $92,000 | $128,000 |
| 2021 | $2,072 | $191,000 | $63,000 | $128,000 |
| 2020 | $2,068 | $174,000 | $17,300 | $156,700 |
| 2019 | $1,893 | $162,500 | $15,100 | $147,400 |
| 2018 | $1,679 | $147,500 | $15,100 | $132,400 |
| 2017 | $1,485 | $119,500 | $13,700 | $105,800 |
| 2016 | $1,537 | $119,500 | $13,700 | $105,800 |
| 2015 | $1,479 | $112,000 | $13,700 | $98,300 |
| 2014 | -- | $104,500 | $13,700 | $90,800 |
Source: Public Records
Map
Nearby Homes
- 3341 40th Ave S
- 3431 38th Ave S
- 3125 44th Ave S
- 3100 43rd Ave S
- 3112 45th Ave S
- 3641 37th Ave S
- 3720 43rd Ave S
- 3009 39th Ave S
- 3706 48th Ave S
- 3624 E 38th St Unit D
- 3516 33rd Ave S
- 3820 47th Ave S
- 3900 40th Ave S
- 3856 45th Ave S
- 3541 Minnehaha Ave
- 3537 Minnehaha Ave
- 2844 38th Ave S
- 3944 41st Ave S
- 3912 37th Ave S
- 3512 Minnehaha Ave
- 4109 E 34th St
- 4105 E 34th St
- 3408 42nd Ave S
- 3400 42nd Ave S
- 3415 41st Ave S
- 4101 E 34th St
- 3410 42nd Ave S
- 3417 41st Ave S
- 3421 41st Ave S
- 3418 42nd Ave S
- 3347 41st Ave S
- 3405 3405 42nd-Avenue-s
- 3411 3411 42nd-Avenue-s
- 3350 42nd Ave S
- 3423 41st Ave S
- 3422 42nd Ave S
- 3343 41st Ave S
- 3425 41st Ave S
- 3404 41st Ave S
- 3400 41st Ave S
Your Personal Tour Guide
Ask me questions while you tour the home.