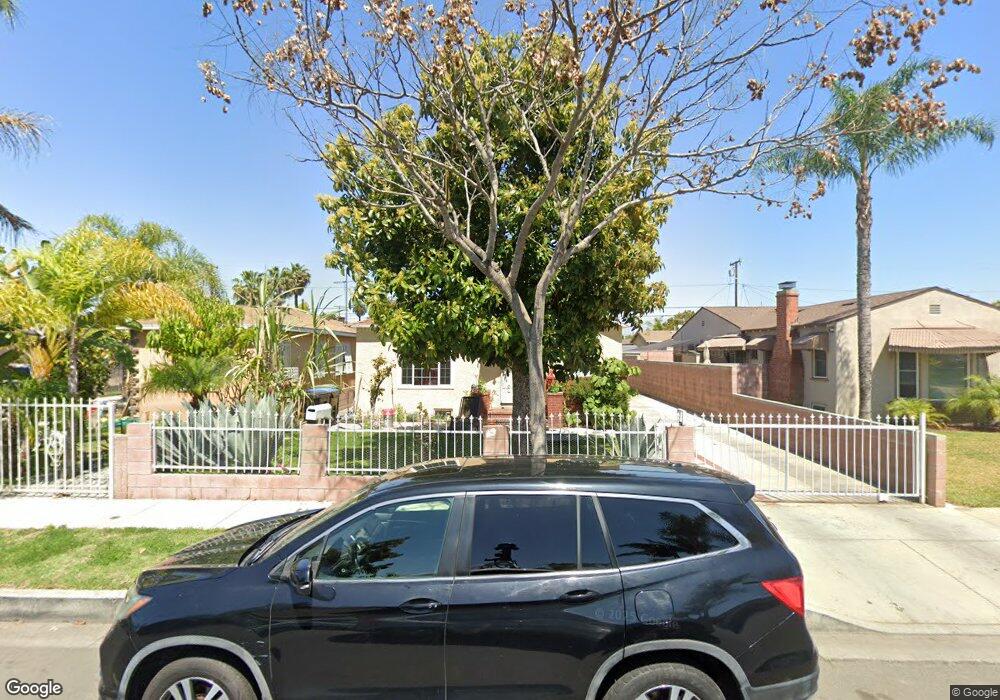
4111 E 56th St Maywood, CA 90270
Estimated Value: $602,917 - $703,000
2
Beds
1
Bath
1,066
Sq Ft
$607/Sq Ft
Est. Value
About This Home
This home is located at 4111 E 56th St, Maywood, CA 90270 and is currently estimated at $646,979, approximately $606 per square foot. 4111 E 56th St is a home located in Los Angeles County with nearby schools including Fishburn Avenue Elementary School, Chester W. Nimitz Middle School, and Maywood Academy High School.
Ownership History
Date
Name
Owned For
Owner Type
Purchase Details
Closed on
Sep 24, 2009
Sold by
Meza Aristeo and Meza Maria Delcarmen
Bought by
Meza Aristeo
Current Estimated Value
Home Financials for this Owner
Home Financials are based on the most recent Mortgage that was taken out on this home.
Original Mortgage
$187,710
Outstanding Balance
$122,074
Interest Rate
5.08%
Mortgage Type
New Conventional
Estimated Equity
$524,905
Purchase Details
Closed on
Nov 28, 2001
Sold by
Meza Aristeo and Montoya Maria Delcarmen
Bought by
Meza Aristeo
Home Financials for this Owner
Home Financials are based on the most recent Mortgage that was taken out on this home.
Original Mortgage
$133,000
Interest Rate
7.15%
Purchase Details
Closed on
Sep 21, 1993
Sold by
Tocker John and Tocker Jeanie S
Bought by
Meza Aristeo
Home Financials for this Owner
Home Financials are based on the most recent Mortgage that was taken out on this home.
Original Mortgage
$145,700
Interest Rate
7.09%
Mortgage Type
FHA
Create a Home Valuation Report for This Property
The Home Valuation Report is an in-depth analysis detailing your home's value as well as a comparison with similar homes in the area
Home Values in the Area
Average Home Value in this Area
Purchase History
| Date | Buyer | Sale Price | Title Company |
|---|---|---|---|
| Meza Aristeo | -- | Chicago Title | |
| Meza Aristeo | -- | Old Republic Title Company | |
| Meza Aristeo | $147,500 | Stewart Title |
Source: Public Records
Mortgage History
| Date | Status | Borrower | Loan Amount |
|---|---|---|---|
| Open | Meza Aristeo | $187,710 | |
| Closed | Meza Aristeo | $133,000 | |
| Previous Owner | Meza Aristeo | $145,700 |
Source: Public Records
Tax History
| Year | Tax Paid | Tax Assessment Tax Assessment Total Assessment is a certain percentage of the fair market value that is determined by local assessors to be the total taxable value of land and additions on the property. | Land | Improvement |
|---|---|---|---|---|
| 2025 | $3,748 | $248,346 | $153,575 | $94,771 |
| 2024 | $3,748 | $243,477 | $150,564 | $92,913 |
| 2023 | $3,685 | $238,704 | $147,612 | $91,092 |
| 2022 | $3,534 | $234,024 | $144,718 | $89,306 |
| 2021 | $3,489 | $229,436 | $141,881 | $87,555 |
| 2019 | $3,383 | $222,633 | $137,674 | $84,959 |
| 2018 | $3,275 | $218,269 | $134,975 | $83,294 |
| 2016 | $3,067 | $209,795 | $129,735 | $80,060 |
| 2015 | $2,894 | $206,645 | $127,787 | $78,858 |
| 2014 | $2,894 | $202,598 | $125,284 | $77,314 |
Source: Public Records
Map
Nearby Homes
- 4101 E 57th St
- 4212 E 58th St
- 5202 Gifford Ave
- 4301 E 60th St
- 3725 E 57th St
- 3738 E 53rd St
- 3700 E 55th St
- 5517 Loma Vista Ave
- 6072 Gifford Ave
- 5115 Loma Vista Ave
- 4020 E 61st St
- 3519 E 60th St
- 6048 King Ave
- 5716 Maywood Ave
- 5824 Heliotrope Ave
- 3602 Randolph Place
- 4026 Gage Ave
- 6600 Fishburn Ave
- 6522 Bear Ave
- 6221 Heliotrope Ave
- 4107 E 56th St
- 4115 E 56th St
- 4101 E 56th St
- 5516 Gifford Ave
- 4119 E 56th St
- 5506 Gifford Ave
- 5504 Gifford Ave
- 4108 E 55th St
- 4125 E 56th St
- 5604 Gifford Ave
- 4059 E 56th St
- 4114 E 55th St
- 4110 E 56th St
- 4114 E 56th St
- 4118 E 56th St
- 4118 E 55th St
- 5606 Gifford Ave
- 4129 E 56th St
- 5515 Gifford Ave
- 4055 E 56th St
Your Personal Tour Guide
Ask me questions while you tour the home.