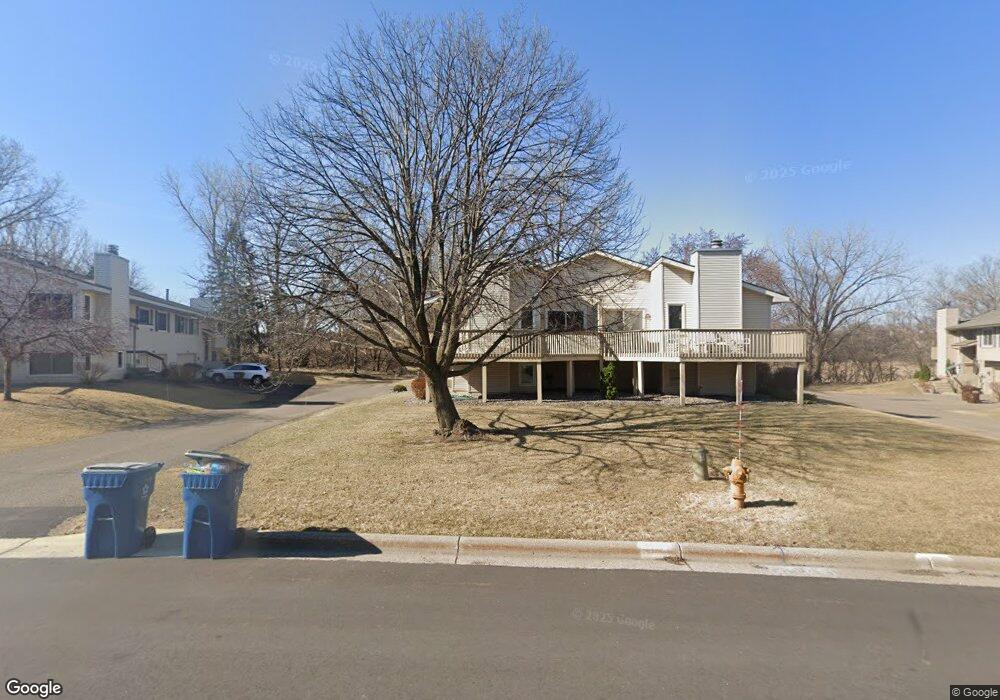
4111 Hemlock Ln N Plymouth, MN 55441
Estimated Value: $267,000 - $309,000
3
Beds
2
Baths
1,086
Sq Ft
$268/Sq Ft
Est. Value
About This Home
This home is located at 4111 Hemlock Ln N, Plymouth, MN 55441 and is currently estimated at $290,888, approximately $267 per square foot. 4111 Hemlock Ln N is a home located in Hennepin County with nearby schools including Zachary Lane Elementary School, Plymouth Middle School, and Armstrong High School.
Ownership History
Date
Name
Owned For
Owner Type
Purchase Details
Closed on
Oct 16, 2017
Sold by
Froehle Steven W and Juday Rosella M
Bought by
Purchell Jeanette F
Current Estimated Value
Home Financials for this Owner
Home Financials are based on the most recent Mortgage that was taken out on this home.
Original Mortgage
$208,550
Outstanding Balance
$174,011
Interest Rate
3.78%
Mortgage Type
New Conventional
Estimated Equity
$116,877
Purchase Details
Closed on
Jul 26, 2006
Sold by
Theisen Cynthia
Bought by
Froehle Steve and Juday Rosella
Purchase Details
Closed on
Jun 27, 2005
Sold by
Namik Khalouk A and Namik Lea R
Bought by
Theisen Cynthia
Purchase Details
Closed on
Feb 26, 1999
Sold by
Burch Lynn A and Burch Patricia A
Bought by
Namik Khalouk A
Purchase Details
Closed on
Jun 30, 1998
Sold by
Palmer Dale G and Palmer Victoria A
Bought by
Burch Lynn A and Burch Patricia A
Create a Home Valuation Report for This Property
The Home Valuation Report is an in-depth analysis detailing your home's value as well as a comparison with similar homes in the area
Home Values in the Area
Average Home Value in this Area
Purchase History
| Date | Buyer | Sale Price | Title Company |
|---|---|---|---|
| Purchell Jeanette F | $215,000 | Minnesota Title | |
| Froehle Steve | $197,000 | -- | |
| Theisen Cynthia | $189,000 | -- | |
| Namik Khalouk A | $117,900 | -- | |
| Burch Lynn A | $117,900 | -- |
Source: Public Records
Mortgage History
| Date | Status | Borrower | Loan Amount |
|---|---|---|---|
| Open | Purchell Jeanette F | $208,550 |
Source: Public Records
Tax History Compared to Growth
Tax History
| Year | Tax Paid | Tax Assessment Tax Assessment Total Assessment is a certain percentage of the fair market value that is determined by local assessors to be the total taxable value of land and additions on the property. | Land | Improvement |
|---|---|---|---|---|
| 2024 | $3,244 | $277,300 | $42,000 | $235,300 |
| 2023 | $2,986 | $273,600 | $37,000 | $236,600 |
| 2022 | $2,758 | $265,000 | $37,000 | $228,000 |
| 2021 | $2,511 | $237,000 | $46,000 | $191,000 |
| 2020 | $2,445 | $218,000 | $35,000 | $183,000 |
| 2019 | $2,353 | $206,000 | $52,000 | $154,000 |
| 2018 | $1,983 | $191,000 | $48,000 | $143,000 |
| 2017 | $1,860 | $152,000 | $40,000 | $112,000 |
| 2016 | $2,095 | $160,000 | $42,000 | $118,000 |
| 2015 | $1,997 | $152,400 | $40,000 | $112,400 |
| 2014 | -- | $139,400 | $39,600 | $99,800 |
Source: Public Records
Map
Nearby Homes
- 4219 Hemlock Ln N
- 12249 42nd Ave N
- 4335 Kirkwood Ln N
- 4415 Jonquil Ln N
- 12610 42nd Place N
- 11545 39th Ave N
- 4620 Forestview Ln N
- 12755 42nd Place N
- 11325 39th Ave N
- 4625 Cottonwood Ln N
- 4230 Ximines Ln N
- 4710 Magnolia Ln N
- 4720 Goldenrod Ln N
- 13025 44th Ave N
- 11725 48th Place N
- 11270 36th Place N
- 3720 Ximines Ln N
- 12236 48th Place N
- 10720 Rockford Rd Unit 215
- 10720 Rockford Rd Unit 113
- 4113 Hemlock Ln N
- 4109 Hemlock Ln N
- 4115 Hemlock Ln N
- 4105 Hemlock Ln N
- 4107 Hemlock Ln N
- 4117 Hemlock Ln N
- 4119 Hemlock Ln N
- 4101 Hemlock Ln N
- 4123 Hemlock Ln N
- 4121 Hemlock Ln N
- 4103 Hemlock Ln N
- 4203 Hemlock Ln N
- 4116 Hemlock Ln N
- 4122 Hemlock Ln N
- 4207 Hemlock Ln N
- 4118 Hemlock Ln N
- 4120 Hemlock Ln N
- 4200 Hemlock Ln N
- 4114 Goldenrod Ln N
- 4206 Hemlock Ln N