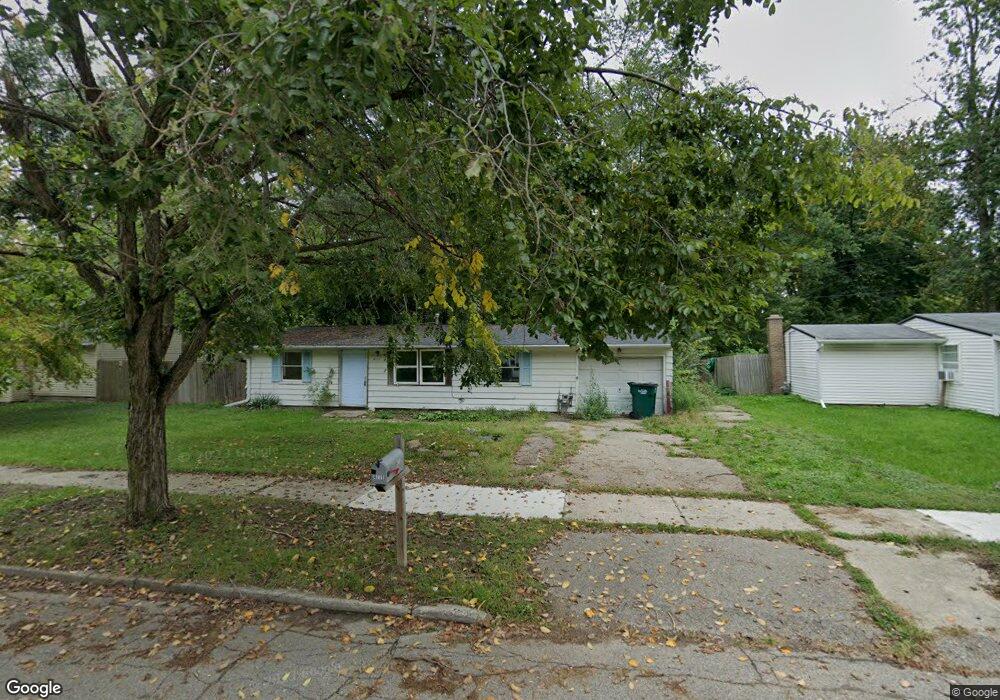
4111 Ingham St Lansing, MI 48911
Pleasant Grove NeighborhoodEstimated Value: $109,000 - $117,000
3
Beds
1
Bath
933
Sq Ft
$121/Sq Ft
Est. Value
About This Home
This home is located at 4111 Ingham St, Lansing, MI 48911 and is currently estimated at $113,000, approximately $121 per square foot. 4111 Ingham St is a home located in Ingham County with nearby schools including Reo Elementary School, Attwood School, and Everett High School.
Ownership History
Date
Name
Owned For
Owner Type
Purchase Details
Closed on
May 11, 2012
Sold by
Lane Dorothy
Bought by
S & S Acquisitions Group Llc
Current Estimated Value
Purchase Details
Closed on
Feb 2, 2012
Sold by
Lane Dorothy
Bought by
S & S Acquisitions Group Llc
Purchase Details
Closed on
Jul 17, 2009
Sold by
Lane Chris B and Lane Sharon
Bought by
Lane Dorothy
Home Financials for this Owner
Home Financials are based on the most recent Mortgage that was taken out on this home.
Original Mortgage
$41,514
Interest Rate
5.62%
Mortgage Type
FHA
Purchase Details
Closed on
Feb 14, 2008
Sold by
Murchison Darnell
Bought by
Hsbc Bank Usa and Friedman Billings Ramsey Group Inc Fbr S
Purchase Details
Closed on
Sep 15, 2003
Sold by
Spawr Michael L
Bought by
Murchison Darnell
Home Financials for this Owner
Home Financials are based on the most recent Mortgage that was taken out on this home.
Original Mortgage
$53,500
Interest Rate
9.3%
Mortgage Type
Purchase Money Mortgage
Create a Home Valuation Report for This Property
The Home Valuation Report is an in-depth analysis detailing your home's value as well as a comparison with similar homes in the area
Home Values in the Area
Average Home Value in this Area
Purchase History
| Date | Buyer | Sale Price | Title Company |
|---|---|---|---|
| S & S Acquisitions Group Llc | -- | None Available | |
| S & S Acquisitions Group Llc | $13,601 | None Available | |
| Lane Dorothy | $48,000 | Bell Title Company | |
| Hsbc Bank Usa | $64,070 | None Available | |
| Murchison Darnell | $43,000 | Simmons Title |
Source: Public Records
Mortgage History
| Date | Status | Borrower | Loan Amount |
|---|---|---|---|
| Previous Owner | Lane Dorothy | $41,514 | |
| Previous Owner | Murchison Darnell | $53,500 |
Source: Public Records
Tax History
| Year | Tax Paid | Tax Assessment Tax Assessment Total Assessment is a certain percentage of the fair market value that is determined by local assessors to be the total taxable value of land and additions on the property. | Land | Improvement |
|---|---|---|---|---|
| 2025 | $2,632 | $48,900 | $7,800 | $41,100 |
| 2024 | $17 | $42,600 | $7,800 | $34,800 |
| 2023 | $1,938 | $37,500 | $7,800 | $29,700 |
| 2022 | $1,847 | $29,400 | $8,700 | $20,700 |
| 2021 | $1,806 | $24,900 | $4,400 | $20,500 |
| 2020 | $1,718 | $23,100 | $4,400 | $18,700 |
| 2019 | $2,969 | $22,000 | $4,400 | $17,600 |
| 2018 | $1,574 | $20,200 | $4,400 | $15,800 |
| 2017 | $1,514 | $20,200 | $4,400 | $15,800 |
| 2016 | $2,735 | $19,900 | $4,400 | $15,500 |
| 2015 | $2,735 | $19,200 | $8,736 | $10,464 |
| 2014 | $2,735 | $19,300 | $13,104 | $6,196 |
Source: Public Records
Map
Nearby Homes
- 3907 Ingham St
- 0 Ingham St
- 4416 Ballard Rd
- 2820 Reo Rd
- 2105 Mary Ave
- 3100 Glenbrook Dr
- 2706 W Jolly Rd
- 1941 Reo Rd
- 1904 Hillcrest St
- 4209 Brighton Dr
- 3214 Raynell St
- 2807 W Jolly Rd
- 4927 Starr Ave
- 3230 S Deerfield Ave
- 0 S Deerfield Ave
- 3924 Wedgewood Dr
- 2416 Midwood St
- 2918 Midwood St
- 4928 Hughes Rd
- 1729 Reo Rd
- 2613 Greenbelt Dr
- 4105 Ingham St
- 4119 Ingham St
- 2607 Greenbelt Dr
- 2612 Fielding Dr
- 4110 Ingham St
- 4116 Ingham St
- 4125 Ingham St
- 2608 Fielding Dr
- 2603 Greenbelt Dr
- 4120 Ingham St
- 4020 Ingham St
- 2517 Greenbelt Dr
- 2710 Fielding Dr
- 2717 Greenbelt Dr
- 2516 Fielding Dr
- 4016 Ingham St
- 4009 Ingham St
- 2716 Fielding Dr
- 2513 Greenbelt Dr
Your Personal Tour Guide
Ask me questions while you tour the home.