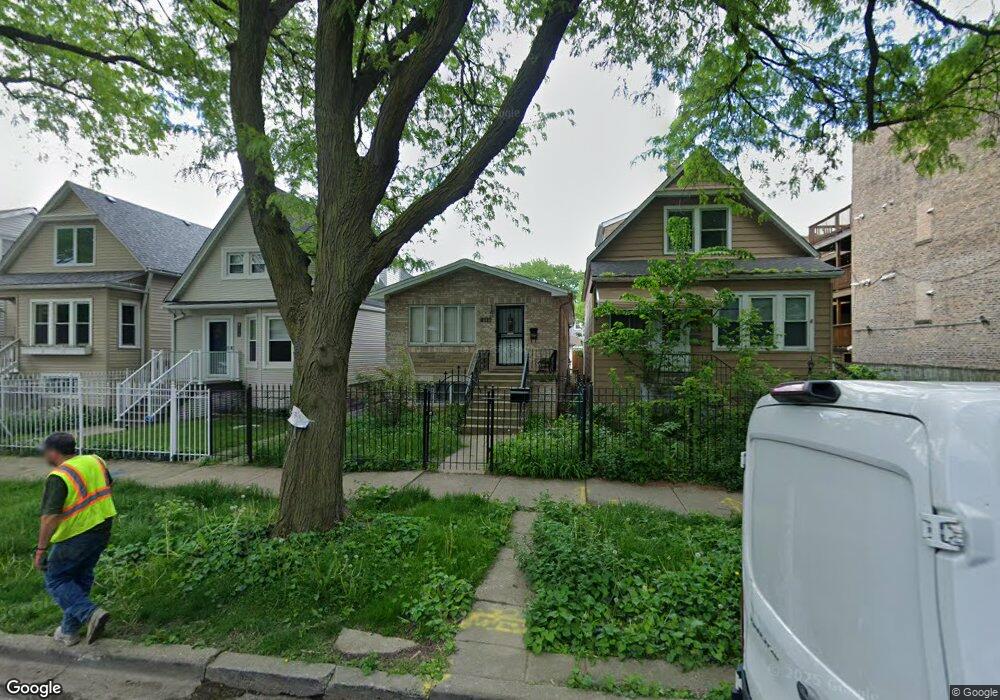
4111 N Lawndale Ave Chicago, IL 60618
Irving Park NeighborhoodEstimated Value: $487,000 - $759,000
3
Beds
2
Baths
1,200
Sq Ft
$543/Sq Ft
Est. Value
About This Home
This home is located at 4111 N Lawndale Ave, Chicago, IL 60618 and is currently estimated at $651,281, approximately $542 per square foot. 4111 N Lawndale Ave is a home located in Cook County with nearby schools including Henry Elementary School, Roosevelt High School, and CICS Irving Park.
Ownership History
Date
Name
Owned For
Owner Type
Purchase Details
Closed on
Sep 17, 2004
Sold by
Grsavac Rozalija and Mazur Mary
Bought by
Martina Pathia Sylvester N and Martina Joseph
Current Estimated Value
Home Financials for this Owner
Home Financials are based on the most recent Mortgage that was taken out on this home.
Original Mortgage
$356,250
Outstanding Balance
$170,459
Interest Rate
5.37%
Mortgage Type
Unknown
Estimated Equity
$480,822
Purchase Details
Closed on
Oct 18, 1996
Sold by
Canavan James
Bought by
Mazur Mary and Grbavac Rozalija
Home Financials for this Owner
Home Financials are based on the most recent Mortgage that was taken out on this home.
Original Mortgage
$151,800
Interest Rate
8.26%
Mortgage Type
FHA
Purchase Details
Closed on
Mar 5, 1996
Sold by
Cole Taylor Bank
Bought by
Canavan James B
Purchase Details
Closed on
Dec 11, 1995
Sold by
American National Bk & Tr Co Of Chicago
Bought by
Cole Taylor Bank
Create a Home Valuation Report for This Property
The Home Valuation Report is an in-depth analysis detailing your home's value as well as a comparison with similar homes in the area
Home Values in the Area
Average Home Value in this Area
Purchase History
| Date | Buyer | Sale Price | Title Company |
|---|---|---|---|
| Martina Pathia Sylvester N | $375,000 | Atgf Inc | |
| Mazur Mary | $165,000 | -- | |
| Canavan James B | $50,000 | -- | |
| Cole Taylor Bank | -- | -- |
Source: Public Records
Mortgage History
| Date | Status | Borrower | Loan Amount |
|---|---|---|---|
| Open | Martina Pathia Sylvester N | $356,250 | |
| Previous Owner | Mazur Mary | $151,800 |
Source: Public Records
Tax History Compared to Growth
Tax History
| Year | Tax Paid | Tax Assessment Tax Assessment Total Assessment is a certain percentage of the fair market value that is determined by local assessors to be the total taxable value of land and additions on the property. | Land | Improvement |
|---|---|---|---|---|
| 2024 | $9,462 | $45,000 | $19,530 | $25,470 |
| 2023 | $9,202 | $48,000 | $15,750 | $32,250 |
| 2022 | $9,202 | $48,000 | $15,750 | $32,250 |
| 2021 | $9,012 | $48,000 | $15,750 | $32,250 |
| 2020 | $7,623 | $37,204 | $6,930 | $30,274 |
| 2019 | $7,642 | $41,338 | $6,930 | $34,408 |
| 2018 | $7,511 | $41,338 | $6,930 | $34,408 |
| 2017 | $6,755 | $34,651 | $6,300 | $28,351 |
| 2016 | $6,462 | $34,651 | $6,300 | $28,351 |
| 2015 | $5,889 | $34,651 | $6,300 | $28,351 |
| 2014 | $5,675 | $33,043 | $5,670 | $27,373 |
| 2013 | $5,552 | $33,043 | $5,670 | $27,373 |
Source: Public Records
Map
Nearby Homes
- 4103 N Lawndale Ave Unit 202
- 4115 N Ridgeway Ave
- 4135 N Monticello Ave
- 3558 W Belle Plaine Ave Unit 3
- 3551 W Belle Plaine Ave Unit 2
- 3707 W Cullom Ave Unit 1
- 4203 N Drake Ave
- 4207 N Drake Ave
- 4304 N Lawndale Ave
- 3907 N Drake Ave
- 4155 N Bernard St Unit G
- 3903 N Drake Ave
- 3611 W Montrose Ave Unit 405
- 3925 N Saint Louis Ave
- 4026 N Kimball Ave
- 3911 N Saint Louis Ave
- 3826 N Hamlin Ave
- 3550 W Montrose Ave Unit 107
- 3908 N Bernard St
- 3923 N Bernard St
- 4113 N Lawndale Ave
- 4109 N Lawndale Ave
- 4117 N Lawndale Ave
- 4119 N Lawndale Ave
- 4105 N Lawndale Ave Unit 301
- 4105 N Lawndale Ave Unit 401
- 4103 N Lawndale Ave Unit 102
- 4103 N Lawndale Ave Unit 402
- 4103 N Lawndale Ave Unit 302
- 3648 W Belle Plaine Ave Unit 40
- 3648 W Belle Plaine Ave Unit 30
- 3648 W Belle Plaine Ave Unit 20
- 3648 W Belle Plaine Ave Unit 20
- 3648 W Belle Plaine Ave Unit 40
- 3648 W Belle Plaine Ave Unit 30
- 3648 W Belle Plaine Ave Unit 305
- 3648 W Belle Plaine Ave Unit 405
- 4121 N Lawndale Ave
- 4125 N Lawndale Ave
- 4112 N Monticello Ave