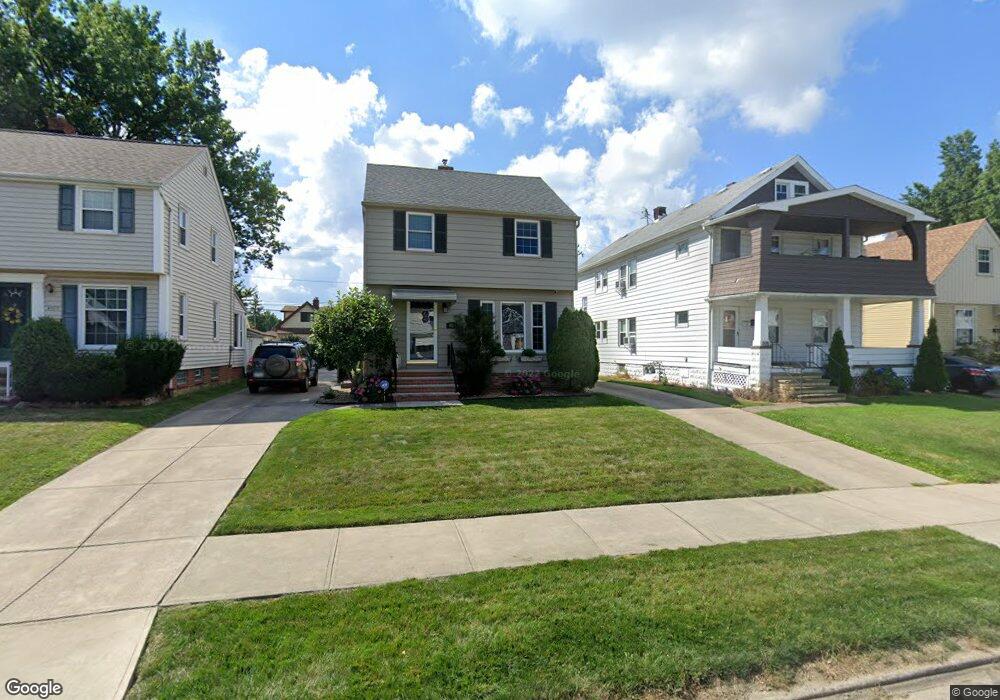
4111 Pershing Ave Cleveland, OH 44134
Estimated Value: $174,000 - $201,000
3
Beds
1
Bath
1,111
Sq Ft
$169/Sq Ft
Est. Value
About This Home
This home is located at 4111 Pershing Ave, Cleveland, OH 44134 and is currently estimated at $188,183, approximately $169 per square foot. 4111 Pershing Ave is a home located in Cuyahoga County with nearby schools including Thoreau Park Elementary School, Shiloh Middle School, and Parma High School.
Ownership History
Date
Name
Owned For
Owner Type
Purchase Details
Closed on
Nov 16, 1999
Sold by
Rich Matthew G
Bought by
Rich Matthew G and Rich Deborah Ann
Current Estimated Value
Home Financials for this Owner
Home Financials are based on the most recent Mortgage that was taken out on this home.
Original Mortgage
$95,194
Outstanding Balance
$28,995
Interest Rate
7.72%
Estimated Equity
$159,188
Purchase Details
Closed on
Nov 4, 1999
Sold by
Wydra John A and Wydra Marie C
Bought by
Rich Matthew G
Home Financials for this Owner
Home Financials are based on the most recent Mortgage that was taken out on this home.
Original Mortgage
$95,194
Outstanding Balance
$28,995
Interest Rate
7.72%
Estimated Equity
$159,188
Purchase Details
Closed on
Jun 9, 1981
Sold by
Weidus Kenneth H
Bought by
Jaris Karen L
Purchase Details
Closed on
Feb 18, 1977
Sold by
Horvath Richard R and C L
Bought by
Weidus Kenneth H
Purchase Details
Closed on
Jan 1, 1975
Bought by
Horvath Richard R and C L
Create a Home Valuation Report for This Property
The Home Valuation Report is an in-depth analysis detailing your home's value as well as a comparison with similar homes in the area
Home Values in the Area
Average Home Value in this Area
Purchase History
| Date | Buyer | Sale Price | Title Company |
|---|---|---|---|
| Rich Matthew G | -- | Quality Title Agency Inc | |
| Rich Matthew G | $96,000 | Quality Title Agency Inc | |
| Jaris Karen L | -- | -- | |
| Wydra John A | $54,000 | -- | |
| Weidus Kenneth H | $39,800 | -- | |
| Horvath Richard R | -- | -- |
Source: Public Records
Mortgage History
| Date | Status | Borrower | Loan Amount |
|---|---|---|---|
| Open | Rich Matthew G | $95,194 |
Source: Public Records
Tax History Compared to Growth
Tax History
| Year | Tax Paid | Tax Assessment Tax Assessment Total Assessment is a certain percentage of the fair market value that is determined by local assessors to be the total taxable value of land and additions on the property. | Land | Improvement |
|---|---|---|---|---|
| 2024 | $3,264 | $53,235 | $10,535 | $42,700 |
| 2023 | $2,870 | $40,110 | $8,680 | $31,430 |
| 2022 | $2,843 | $40,110 | $8,680 | $31,430 |
| 2021 | $2,923 | $40,110 | $8,680 | $31,430 |
| 2020 | $2,563 | $30,870 | $6,690 | $24,190 |
| 2019 | $2,452 | $88,200 | $19,100 | $69,100 |
| 2018 | $2,329 | $30,870 | $6,690 | $24,190 |
| 2017 | $2,354 | $27,450 | $5,010 | $22,440 |
| 2016 | $2,339 | $27,450 | $5,010 | $22,440 |
| 2015 | $2,227 | $27,450 | $5,010 | $22,440 |
| 2014 | $2,227 | $28,000 | $5,110 | $22,890 |
Source: Public Records
Map
Nearby Homes
- 4005 Pershing Ave
- 4000 Pershing Ave
- 3910 Wood Ave
- 4420 Torrington Ave
- 3710 Wood Ave
- 4409 Milford Ave
- 5521 W 48th St
- 5432 State Rd
- 5000 Torrington Ave
- 4323 Russell Ave
- 5212 Wood Ave
- 3714 Russell Ave
- 4424 Forestwood Dr
- 3107 Brookdale Ave
- 4439 Woodway Ave
- 3111 Liggett Dr
- 4910 Russell Ave
- 4315 Woodway Ave
- 4311 Woodway Ave
- 4915 Tuxedo Ave
- 4203 Pershing Ave
- 4101 Pershing Ave
- 4207 Pershing Ave
- 4017 Pershing Ave
- 4211 Pershing Ave
- 4110 Wood Ave
- 4106 Wood Ave
- 4202 Wood Ave
- 4102 Wood Ave
- 4206 Wood Ave
- 4013 Pershing Ave
- 4303 Pershing Ave
- 4210 Wood Ave
- 4110 Pershing Ave
- 4106 Pershing Ave
- 4202 Pershing Ave
- 4009 Pershing Ave
- 4307 Pershing Ave
- 4102 Pershing Ave
- 4012 Wood Ave