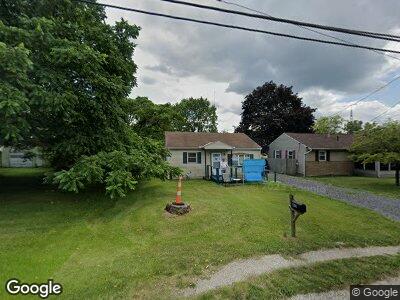
4112 21st St SW Canton, OH 44706
Estimated Value: $99,880 - $118,000
2
Beds
1
Bath
672
Sq Ft
$157/Sq Ft
Est. Value
About This Home
This home is located at 4112 21st St SW, Canton, OH 44706 and is currently estimated at $105,470, approximately $156 per square foot. 4112 21st St SW is a home located in Stark County with nearby schools including Faircrest Memorial Elementary School, Canton South High School, and Beacon Academy.
Ownership History
Date
Name
Owned For
Owner Type
Purchase Details
Closed on
Feb 24, 2015
Sold by
Equity Trust Company
Bought by
Kmi Investments Llc
Current Estimated Value
Purchase Details
Closed on
Sep 22, 2005
Sold by
Tre Properties Llc
Bought by
Equity Trust Co and Larry Fry Ira
Purchase Details
Closed on
May 11, 2005
Sold by
Lichtenwalter Darren R and Lichtenwalter Dennis R
Bought by
Tre Properties Llc
Purchase Details
Closed on
May 30, 2001
Sold by
Carr Melinda A and Carr John
Bought by
Hud
Purchase Details
Closed on
Mar 24, 1999
Sold by
Ramsey Roger E
Bought by
Carr Melinda A
Purchase Details
Closed on
Jul 15, 1994
Sold by
Patterson Russell
Bought by
Ramsey Roger E
Home Financials for this Owner
Home Financials are based on the most recent Mortgage that was taken out on this home.
Original Mortgage
$30,150
Interest Rate
8.6%
Mortgage Type
FHA
Purchase Details
Closed on
Apr 14, 1989
Create a Home Valuation Report for This Property
The Home Valuation Report is an in-depth analysis detailing your home's value as well as a comparison with similar homes in the area
Home Values in the Area
Average Home Value in this Area
Purchase History
| Date | Buyer | Sale Price | Title Company |
|---|---|---|---|
| Kmi Investments Llc | $40,000 | None Available | |
| Equity Trust Co | $67,000 | -- | |
| Tre Properties Llc | $24,300 | -- | |
| Hud | $30,000 | -- | |
| Carr Melinda A | -- | -- | |
| Ramsey Roger E | $29,900 | -- | |
| -- | $20,000 | -- |
Source: Public Records
Mortgage History
| Date | Status | Borrower | Loan Amount |
|---|---|---|---|
| Previous Owner | Ramsey Roger E | $30,150 |
Source: Public Records
Tax History Compared to Growth
Tax History
| Year | Tax Paid | Tax Assessment Tax Assessment Total Assessment is a certain percentage of the fair market value that is determined by local assessors to be the total taxable value of land and additions on the property. | Land | Improvement |
|---|---|---|---|---|
| 2024 | -- | $15,790 | $5,250 | $10,540 |
| 2023 | $649 | $14,080 | $4,310 | $9,770 |
| 2022 | $606 | $14,080 | $4,310 | $9,770 |
| 2021 | $609 | $14,080 | $4,310 | $9,770 |
| 2020 | $571 | $11,590 | $3,640 | $7,950 |
| 2019 | $574 | $11,590 | $3,640 | $7,950 |
| 2018 | $576 | $11,590 | $3,640 | $7,950 |
| 2017 | $566 | $10,750 | $3,470 | $7,280 |
| 2016 | $541 | $10,260 | $3,470 | $6,790 |
| 2015 | $542 | $10,260 | $3,470 | $6,790 |
| 2014 | $559 | $9,940 | $3,360 | $6,580 |
| 2013 | $283 | $9,940 | $3,360 | $6,580 |
Source: Public Records
Map
Nearby Homes
- 3227 Arbor Rd SW
- 1549 Quimby Ave SW
- 2123 Sandwith Ave SW
- 1544 Quimby Ave SW
- 3133 14th St SW
- 3000 16th St SW
- 1313 Linwood Ave SW
- 1627 Sandwith Ave SW
- 2104 Tanner Ave SW
- 1233 Rockwood Ave SW
- 1245 Fairlane Ave SW
- 3311 13th St SW
- 1242 Linwood Ave SW
- 1152 Rockwood Ave SW
- 1402 Channonbrook St SW Unit C5A
- 1216 Maryland Ave SW
- 1225 Concord Ave SW
- 4838 Kendal St SW
- 1126 Ellwood Ave SW
- 1815 Vine Ave SW
- 4112 21st St SW
- 2115 Calvin Ave SW
- 4102 21st St SW
- 4126 21st St SW
- 2114 Calvin Ave SW
- 2124 Calvin Ave SW
- 4014 21st St SW
- 4013 21st St SW
- 2130 Calvin Ave SW
- 4009 21st St SW
- 4006 21st St SW
- 2134 Calvin Ave SW
- 2137 Calvin Ave SW
- 4005 21st St SW
- 4002 21st St SW
- 2115 Buddy Ave SW
- 4001 21st St SW
- 2140 Calvin Ave SW
- 2137 Buddy Ave SW
- 3922 21st St SW